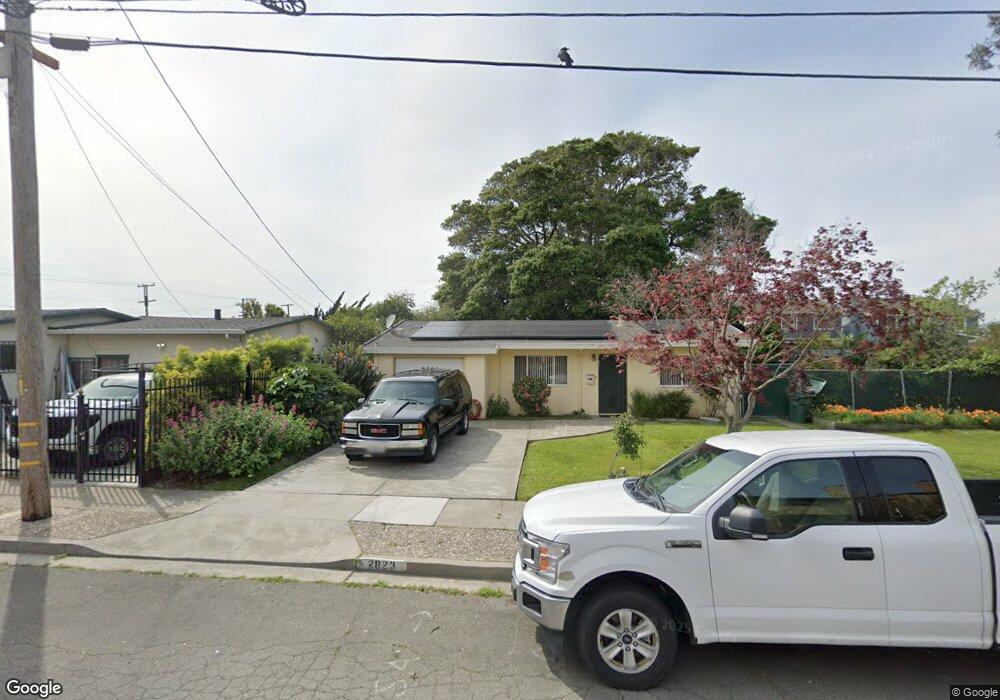
2823 21st St San Pablo, CA 94806
Estimated Value: $430,122 - $490,000
2
Beds
1
Bath
783
Sq Ft
$577/Sq Ft
Est. Value
About This Home
This home is located at 2823 21st St, San Pablo, CA 94806 and is currently estimated at $452,031, approximately $577 per square foot. 2823 21st St is a home located in Contra Costa County with nearby schools including Bayview Elementary School, Betty Reid Soskin Middle School, and De Anza Senior High School.
Ownership History
Date
Name
Owned For
Owner Type
Purchase Details
Closed on
Jan 18, 2000
Sold by
Mitchell Nancy and Mitchell Stanley Wayne
Bought by
Johnson Michael F and Johnson Helen A
Current Estimated Value
Home Financials for this Owner
Home Financials are based on the most recent Mortgage that was taken out on this home.
Original Mortgage
$134,102
Outstanding Balance
$42,992
Interest Rate
7.96%
Mortgage Type
FHA
Estimated Equity
$409,039
Purchase Details
Closed on
Jan 11, 2000
Sold by
Wayne Mitchell Stanley and Wayne Nancy Mitchell
Bought by
Johnson Michael F and Johnson Helen A
Home Financials for this Owner
Home Financials are based on the most recent Mortgage that was taken out on this home.
Original Mortgage
$134,102
Outstanding Balance
$42,992
Interest Rate
7.96%
Mortgage Type
FHA
Estimated Equity
$409,039
Purchase Details
Closed on
Mar 4, 1998
Sold by
Mitchell Robert L
Bought by
Mitchell Stanley Wayne
Create a Home Valuation Report for This Property
The Home Valuation Report is an in-depth analysis detailing your home's value as well as a comparison with similar homes in the area
Home Values in the Area
Average Home Value in this Area
Purchase History
| Date | Buyer | Sale Price | Title Company |
|---|---|---|---|
| Johnson Michael F | $6,000 | Chicago Title Co | |
| Johnson Michael F | $135,000 | Chicago Title Co | |
| Mitchell Stanley Wayne | $40,000 | -- |
Source: Public Records
Mortgage History
| Date | Status | Borrower | Loan Amount |
|---|---|---|---|
| Open | Johnson Michael F | $134,102 | |
| Closed | Johnson Michael F | $6,750 |
Source: Public Records
Tax History Compared to Growth
Tax History
| Year | Tax Paid | Tax Assessment Tax Assessment Total Assessment is a certain percentage of the fair market value that is determined by local assessors to be the total taxable value of land and additions on the property. | Land | Improvement |
|---|---|---|---|---|
| 2025 | $3,728 | $207,469 | $107,577 | $99,892 |
| 2024 | $3,638 | $203,402 | $105,468 | $97,934 |
| 2023 | $3,638 | $199,414 | $103,400 | $96,014 |
| 2022 | $3,572 | $195,505 | $101,373 | $94,132 |
| 2021 | $3,536 | $191,673 | $99,386 | $92,287 |
| 2019 | $3,351 | $185,989 | $96,439 | $89,550 |
| 2018 | $3,209 | $182,344 | $94,549 | $87,795 |
| 2017 | $3,111 | $178,770 | $92,696 | $86,074 |
| 2016 | $3,041 | $175,266 | $90,879 | $84,387 |
| 2015 | $3,004 | $172,634 | $89,514 | $83,120 |
| 2014 | $2,980 | $169,253 | $87,761 | $81,492 |
Source: Public Records
Map
Nearby Homes
- 2830 21st St Unit 32
- 2773 21st St
- 2867 18th St
- 2854 16th St
- 14433 San Pablo Ave
- 2489 20th St
- 2796 13th St
- 1911 Miner Ave
- 2817 13th St
- 2705 Glasgow Ct
- 3316 Monte Buena St
- 1905 Lovegrove Ave
- 117 Carmel St
- 2518 Manchester Ave
- 19 Haviland Ct
- 1371 Palmer Ave
- 2872 10th St Unit 70
- 2716 Holly St
- 1111 Stonington Ave
- 2011 Espanola Dr
- 2029 Lake St
- 2095 Lake St
- 2833 21st St
- 2826 20th St
- 2830 20th St
- 2816 20th St
- 2830 21st St
- 2830 21st St Unit 25
- 2830 21st St Unit 24
- 2830 21st St Unit 23
- 2830 21st St Unit 22
- 2830 21st St Unit 21
- 2830 21st St Unit 20
- 2830 21st St Unit 19
- 2830 21st St Unit 18
- 2830 21st St Unit 16
- 2830 21st St Unit 15
- 2830 21st St Unit 14
- 2830 21st St Unit 13
- 2830 21st St Unit 12