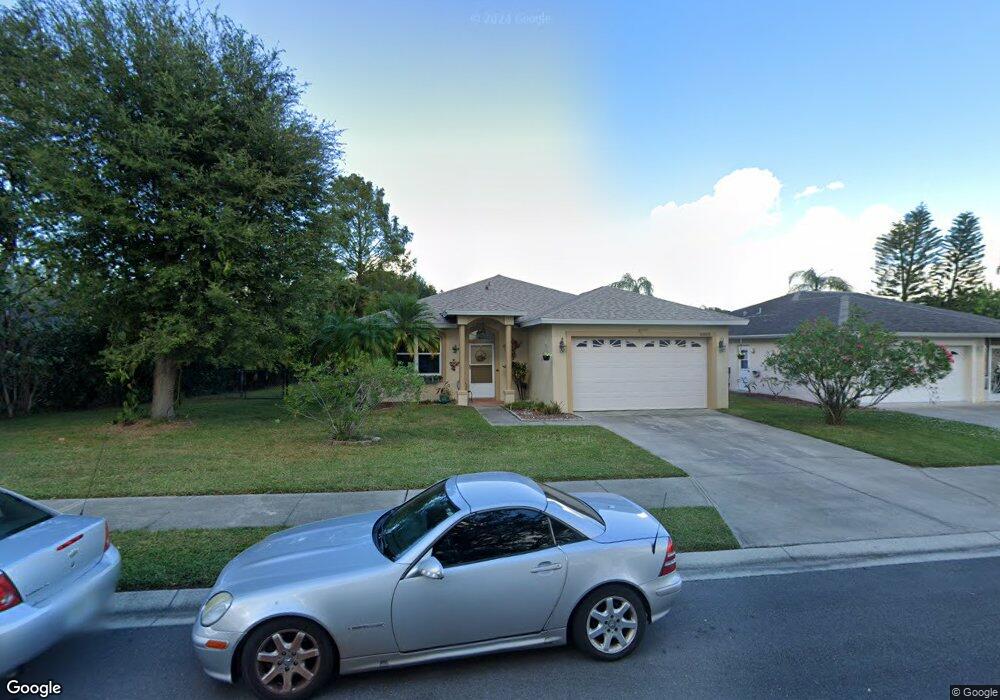
2823 56th Avenue Cir E Bradenton, FL 34203
Braden River NeighborhoodEstimated Value: $351,540 - $390,000
3
Beds
2
Baths
1,588
Sq Ft
$236/Sq Ft
Est. Value
About This Home
This home is located at 2823 56th Avenue Cir E, Bradenton, FL 34203 and is currently estimated at $374,135, approximately $235 per square foot. 2823 56th Avenue Cir E is a home located in Manatee County with nearby schools including Oneco Elementary School, Braden River Middle School, and Braden River High School.
Ownership History
Date
Name
Owned For
Owner Type
Purchase Details
Closed on
Nov 15, 2021
Sold by
Bennick Louise
Bought by
Bennick Louise and Louise Bennick Trust
Current Estimated Value
Purchase Details
Closed on
Sep 23, 2010
Sold by
Bennick Frank and Bennick Louise
Bought by
Bennick Louise
Purchase Details
Closed on
Mar 18, 2005
Sold by
Stone Thomas J and Stone Deborah A
Bought by
Bennick Frank T and Bennick Louise
Home Financials for this Owner
Home Financials are based on the most recent Mortgage that was taken out on this home.
Original Mortgage
$193,600
Outstanding Balance
$96,586
Interest Rate
5.37%
Mortgage Type
Purchase Money Mortgage
Estimated Equity
$277,549
Purchase Details
Closed on
Jan 28, 2000
Sold by
Haney Michael D and Haney Dayna K
Bought by
Stone Thomas J and Hurry Deborah A
Home Financials for this Owner
Home Financials are based on the most recent Mortgage that was taken out on this home.
Original Mortgage
$119,310
Interest Rate
8.11%
Purchase Details
Closed on
Nov 30, 1998
Sold by
S W Fl Dev Inc
Bought by
Haney Michael D and Haney Dayna R
Create a Home Valuation Report for This Property
The Home Valuation Report is an in-depth analysis detailing your home's value as well as a comparison with similar homes in the area
Home Values in the Area
Average Home Value in this Area
Purchase History
| Date | Buyer | Sale Price | Title Company |
|---|---|---|---|
| Bennick Louise | -- | Attorney | |
| Bennick Louise | -- | Attorney | |
| Bennick Frank T | $242,000 | Signature Title Service Llc | |
| Stone Thomas J | $123,000 | -- | |
| Haney Michael D | $30,000 | -- |
Source: Public Records
Mortgage History
| Date | Status | Borrower | Loan Amount |
|---|---|---|---|
| Open | Bennick Frank T | $193,600 | |
| Previous Owner | Stone Thomas J | $119,310 |
Source: Public Records
Tax History Compared to Growth
Tax History
| Year | Tax Paid | Tax Assessment Tax Assessment Total Assessment is a certain percentage of the fair market value that is determined by local assessors to be the total taxable value of land and additions on the property. | Land | Improvement |
|---|---|---|---|---|
| 2025 | $1,542 | $129,618 | -- | -- |
| 2024 | $1,542 | $125,965 | -- | -- |
| 2023 | $1,496 | $122,296 | $0 | $0 |
| 2022 | $1,438 | $118,734 | $0 | $0 |
| 2021 | $1,358 | $115,276 | $0 | $0 |
| 2020 | $1,388 | $113,684 | $0 | $0 |
| 2019 | $1,351 | $111,128 | $0 | $0 |
| 2018 | $1,325 | $109,056 | $0 | $0 |
| 2017 | $1,206 | $106,813 | $0 | $0 |
| 2016 | $1,206 | $104,616 | $0 | $0 |
| 2015 | $1,205 | $103,889 | $0 | $0 |
| 2014 | $1,205 | $103,064 | $0 | $0 |
| 2013 | $1,184 | $101,541 | $0 | $0 |
Source: Public Records
Map
Nearby Homes
- 5717 28th St E
- 3157 57th Avenue Cir E
- 5682 25th Street Cir E
- 5528 24th St E
- 3117 57th Avenue Cir E
- 5311 24th Street Ct E
- 3404 56th Dr E
- 5542 34th Ct E
- 3427 55th Dr E
- 5310 22nd Street Ct E
- 2206 53rd Ave E
- 5231 32nd St E
- 2008 55th Ave E
- 5714 Garden Lakes Fern
- 5502 Garden Lakes Oak
- 5807 Garden Lakes Fern Unit 181
- 5517 Garden Lakes Oak Unit 1
- 5114 33rd St E
- 5024 33rd St E
- 5727 Garden Lakes Palm Unit 97
- 2837 56th Avenue Cir E Unit 3
- 2819 56th Avenue Cir E
- 2841 56th Avenue Cir E
- 2815 56th Avenue Cir E
- 2822 56th Avenue Cir E
- 2818 56th Avenue Cir E
- 2845 56th Avenue Cir E
- 2826 56th Avenue Cir E
- 2814 56th Avenue Cir E
- 2809 56th Avenue Cir E
- 2838 56th Avenue Cir E
- 2838 56th Ave Cir E
- 2830 56th Avenue Cir E
- 2842 56th Avenue Cir E
- 2810 56th Avenue Cir E
- 2849 56th Avenue Cir E
- 2846 56th Avenue Cir E
- 2865 56th Avenue Cir E
- 2869 56th Avenue Cir E
- 2805 56th Avenue Cir E Unit 3