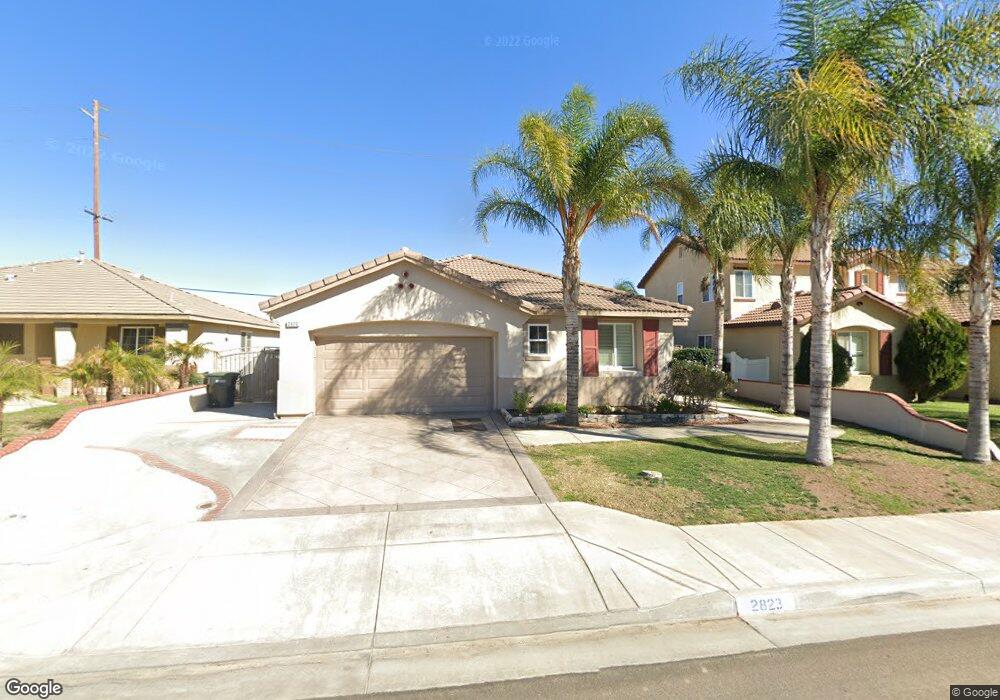
2823 Lake View Dr Perris, CA 92571
Central Perris NeighborhoodEstimated Value: $530,000 - $572,000
3
Beds
2
Baths
1,926
Sq Ft
$284/Sq Ft
Est. Value
About This Home
This home is located at 2823 Lake View Dr, Perris, CA 92571 and is currently estimated at $546,782, approximately $283 per square foot. 2823 Lake View Dr is a home located in Riverside County with nearby schools including Sierra Vista Elementary School, Lakeside Middle School, and Rancho Verde High School.
Ownership History
Date
Name
Owned For
Owner Type
Purchase Details
Closed on
Feb 21, 2008
Sold by
Federal Home Loan Mortgage Corporation
Bought by
Gallegos Jose V
Current Estimated Value
Home Financials for this Owner
Home Financials are based on the most recent Mortgage that was taken out on this home.
Original Mortgage
$183,920
Outstanding Balance
$113,500
Interest Rate
5.65%
Mortgage Type
New Conventional
Estimated Equity
$433,282
Purchase Details
Closed on
Feb 13, 2008
Sold by
Gallegos Mireya
Bought by
Gallegos Jose
Home Financials for this Owner
Home Financials are based on the most recent Mortgage that was taken out on this home.
Original Mortgage
$183,920
Outstanding Balance
$113,500
Interest Rate
5.65%
Mortgage Type
New Conventional
Estimated Equity
$433,282
Purchase Details
Closed on
Dec 11, 2007
Sold by
Ocampo Agustina
Bought by
Federal Home Loan Mortgage Corporation
Purchase Details
Closed on
Nov 7, 2005
Sold by
Perris Clc Llc
Bought by
Ocampo Agustina
Home Financials for this Owner
Home Financials are based on the most recent Mortgage that was taken out on this home.
Original Mortgage
$294,000
Interest Rate
6.35%
Mortgage Type
Fannie Mae Freddie Mac
Create a Home Valuation Report for This Property
The Home Valuation Report is an in-depth analysis detailing your home's value as well as a comparison with similar homes in the area
Home Values in the Area
Average Home Value in this Area
Purchase History
| Date | Buyer | Sale Price | Title Company |
|---|---|---|---|
| Gallegos Jose V | $229,900 | Chicago Title Company | |
| Gallegos Jose | -- | Chicago Title Company | |
| Federal Home Loan Mortgage Corporation | $326,600 | Accommodation | |
| Ocampo Agustina | $392,000 | Fidelity National Title Buil |
Source: Public Records
Mortgage History
| Date | Status | Borrower | Loan Amount |
|---|---|---|---|
| Open | Gallegos Jose V | $183,920 | |
| Previous Owner | Ocampo Agustina | $294,000 |
Source: Public Records
Tax History
| Year | Tax Paid | Tax Assessment Tax Assessment Total Assessment is a certain percentage of the fair market value that is determined by local assessors to be the total taxable value of land and additions on the property. | Land | Improvement |
|---|---|---|---|---|
| 2025 | $6,860 | $301,959 | $91,937 | $210,022 |
| 2023 | $6,860 | $290,235 | $88,368 | $201,867 |
| 2022 | $5,946 | $284,545 | $86,636 | $197,909 |
| 2021 | $5,832 | $278,967 | $84,938 | $194,029 |
| 2020 | $5,790 | $276,108 | $84,068 | $192,040 |
| 2019 | $5,631 | $270,695 | $82,420 | $188,275 |
| 2018 | $5,569 | $265,388 | $80,804 | $184,584 |
| 2017 | $5,492 | $260,185 | $79,220 | $180,965 |
| 2016 | $5,473 | $255,084 | $77,667 | $177,417 |
| 2015 | $5,241 | $236,000 | $72,000 | $164,000 |
| 2014 | $5,274 | $235,000 | $72,000 | $163,000 |
Source: Public Records
Map
Nearby Homes
- 0 Redlands Ave Unit SW26063801
- 136 San Luis Dr
- 2607 Ferdinand Ct
- 2536 Slew of Gold Ct
- 49 Bold Venture St
- 26625 Placentia Ave
- 166 Ambrosia Ct
- 2269 Firebrand Ave
- 716 Periwinkle Ln
- 2292 Tiger Lilly Way
- 575 Prairie Way
- 676 Fuchsia Ln
- 705 Fuchsia Ln
- 2293 Murrieta Rd
- 723 Anthirium Ave
- 2248 Ridge Ct
- 763 Anthirium Ave
- 3236 Mariposa Way
- 377 Aurora Dr
- 2036 Cherrytree Dr
- 2817 Lake View Dr
- 2829 Lake View Dr
- 2835 Lake View Dr
- 2808 Lake View Dr
- 2841 Lake View Dr
- 2802 Lake View Dr
- 2826 Lake View Dr
- 2847 Lake View Dr
- 345 Jubilee Ct
- 2832 Lake View Dr
- 2853 Lake View Dr
- 337 Jubilee Ct
- 326 Jubilee Ct
- 367 Placentia Ave
- 2838 Lake View Dr
- 2859 Lake View Dr
- 329 Jubilee Ct
- 318 Jubilee Ct
- 2865 Lake View Dr
- 321 Jubilee Ct
Your Personal Tour Guide
Ask me questions while you tour the home.