Estimated Value: $679,000 - $1,249,000
4
Beds
2
Baths
3,076
Sq Ft
$327/Sq Ft
Est. Value
About This Home
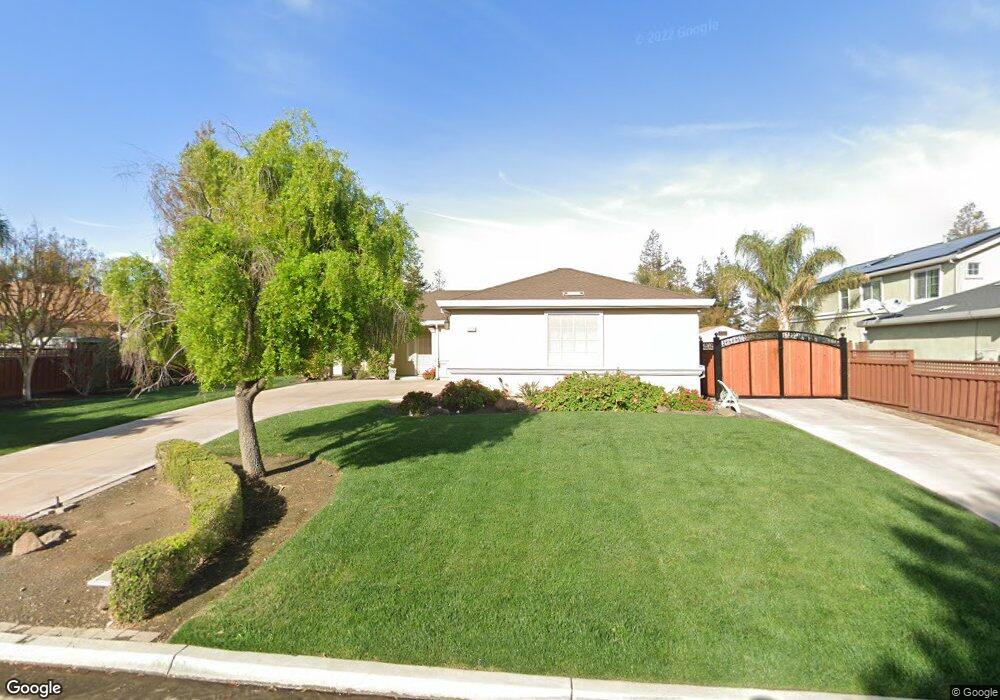
This home is located at 28239 S Zephyr Dr, Tracy, CA 95304 and is currently estimated at $1,006,540, approximately $327 per square foot. 28239 S Zephyr Dr is a home located in San Joaquin County with nearby schools including Monticello Elementary School, Jefferson, and Tracy High School.
Ownership History
Date
Name
Owned For
Owner Type
Purchase Details
Closed on
Dec 4, 2018
Sold by
Gentry Robert K and Gentry Valerie L
Bought by
Gentry Robert K and Gentry Valerie L
Current Estimated Value
Purchase Details
Closed on
Nov 14, 2011
Sold by
Costello Brenda J and Costello Ronald E
Bought by
Gentry Robert K and Gentry Valerie L
Home Financials for this Owner
Home Financials are based on the most recent Mortgage that was taken out on this home.
Original Mortgage
$310,000
Outstanding Balance
$209,853
Interest Rate
3.87%
Mortgage Type
Purchase Money Mortgage
Estimated Equity
$796,687
Purchase Details
Closed on
Jun 1, 2005
Sold by
Ryland Homes Of California Inc
Bought by
Costello Ronald E and Costello Brenda J
Home Financials for this Owner
Home Financials are based on the most recent Mortgage that was taken out on this home.
Original Mortgage
$330,000
Interest Rate
5.72%
Mortgage Type
Fannie Mae Freddie Mac
Create a Home Valuation Report for This Property
The Home Valuation Report is an in-depth analysis detailing your home's value as well as a comparison with similar homes in the area
Home Values in the Area
Average Home Value in this Area
Purchase History
| Date | Buyer | Sale Price | Title Company |
|---|---|---|---|
| Gentry Robert K | -- | None Available | |
| Gentry Robert K | $410,000 | Old Republic Title Company | |
| Costello Ronald E | $729,000 | First Amer Title Co |
Source: Public Records
Mortgage History
| Date | Status | Borrower | Loan Amount |
|---|---|---|---|
| Open | Gentry Robert K | $310,000 | |
| Previous Owner | Costello Ronald E | $330,000 |
Source: Public Records
Tax History Compared to Growth
Tax History
| Year | Tax Paid | Tax Assessment Tax Assessment Total Assessment is a certain percentage of the fair market value that is determined by local assessors to be the total taxable value of land and additions on the property. | Land | Improvement |
|---|---|---|---|---|
| 2025 | $9,180 | $546,803 | $128,112 | $418,691 |
| 2024 | $8,966 | $536,082 | $125,600 | $410,482 |
| 2023 | $8,705 | $525,572 | $123,138 | $402,434 |
| 2022 | $8,130 | $485,268 | $120,724 | $364,544 |
| 2021 | $7,896 | $475,754 | $118,357 | $357,397 |
| 2020 | $7,737 | $470,877 | $117,144 | $353,733 |
| 2019 | $6,940 | $461,646 | $114,848 | $346,798 |
| 2018 | $7,044 | $452,596 | $112,597 | $339,999 |
| 2017 | $6,903 | $443,723 | $110,390 | $333,333 |
| 2016 | $6,810 | $435,022 | $108,225 | $326,797 |
| 2014 | $6,626 | $420,098 | $104,512 | $315,586 |
Source: Public Records
Map
Nearby Homes
- 28344 Lindly Ln
- 28031 S Alycia Way
- 24759 S Chrisman Rd
- 27978 S Traina Ct
- 27943 S Fagin Dr
- 8485 Ranch Rd
- 8540 W Bates Ct
- 27000 S Hillview St
- 2662 Pyramid Dr
- 29879 S Chrisman Rd
- 890 Winnipeg Ct
- 418 Cose Ln
- 426 Darlene Ln
- 4700 Glenbrook Dr
- 322 Kelley Mist Ct
- 349 Cose Ln
- 4276 Oakridge Dr
- 677 Harold Smith Dr
- 261 Kelley Mist Ct
- 232 Kelley Mist Ln
- 7842 W Depot Master Dr
- 28263 S Zephyr Dr
- 28252 S Lindly Ln
- 28214 S Lindly Ln
- 28285 S Zephyr Dr
- 28250 S Zephyr Dr
- 7851 W Depot Master Dr
- 28286 S Lindly Ln
- 28224 S Zephyr Dr
- 28200 S Zephyr Dr
- 28321 S Zephyr Dr
- 7873 W Depot Master Dr
- 28300 S Zephyr Dr
- 28257 S Lindly Ln
- 28135 S Zephyr Dr
- 28215 S Lindly Ln
- 28289 S Lindly Ln
- 28168 S Zephyr Dr
- 28279 S Luciano Ave
- 28243 S Luciano Ave