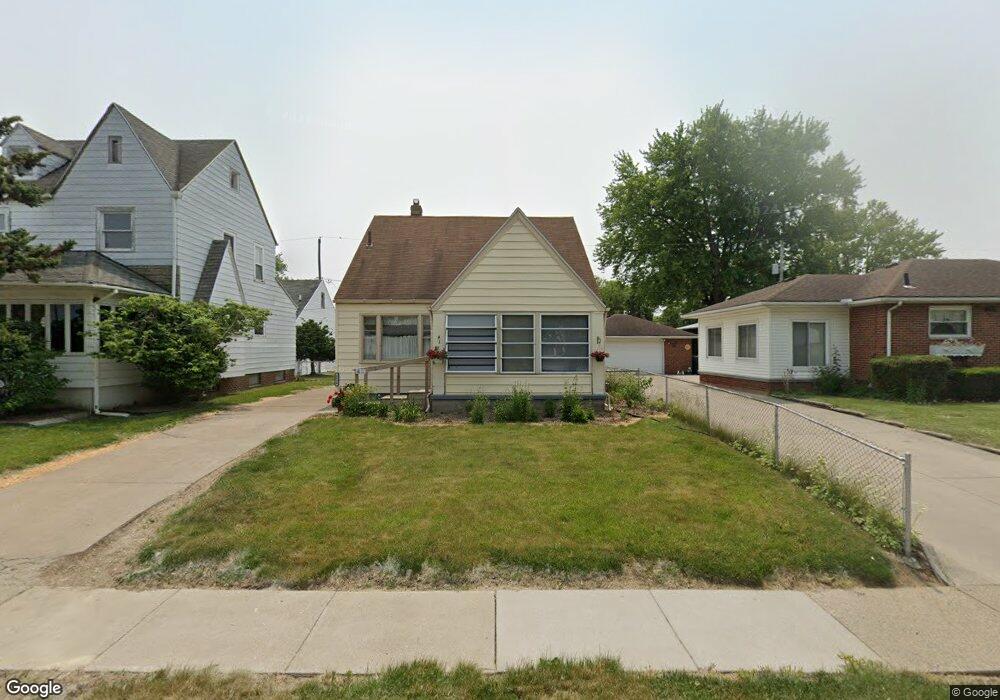
2824 105th St Toledo, OH 43611
Point Place NeighborhoodEstimated Value: $124,000 - $145,000
3
Beds
1
Bath
1,326
Sq Ft
$105/Sq Ft
Est. Value
About This Home
This home is located at 2824 105th St, Toledo, OH 43611 and is currently estimated at $139,222, approximately $104 per square foot. 2824 105th St is a home located in Lucas County with nearby schools including Ottawa River Elementary School, Woodward High School, and Imagine Environmental Science Academy.
Ownership History
Date
Name
Owned For
Owner Type
Purchase Details
Closed on
Aug 24, 2018
Sold by
Gorney Mary Ann and Mary Ann Gorney Living Trust
Bought by
Gorney Steven
Current Estimated Value
Purchase Details
Closed on
Jun 7, 2005
Sold by
Gorney Mary Ann
Bought by
Gorney Mary Ann and Mary Ann Gorney Living Trust
Purchase Details
Closed on
Sep 8, 2004
Sold by
Smalldon Paul E
Bought by
Gorney Mary Ann
Create a Home Valuation Report for This Property
The Home Valuation Report is an in-depth analysis detailing your home's value as well as a comparison with similar homes in the area
Home Values in the Area
Average Home Value in this Area
Purchase History
| Date | Buyer | Sale Price | Title Company |
|---|---|---|---|
| Gorney Steven | -- | None Available | |
| Gorney Mary Ann | -- | -- | |
| Gorney Mary Ann | $95,000 | Louisville Title Agency For |
Source: Public Records
Tax History Compared to Growth
Tax History
| Year | Tax Paid | Tax Assessment Tax Assessment Total Assessment is a certain percentage of the fair market value that is determined by local assessors to be the total taxable value of land and additions on the property. | Land | Improvement |
|---|---|---|---|---|
| 2024 | $1,003 | $32,305 | $6,090 | $26,215 |
| 2023 | $1,619 | $24,640 | $5,355 | $19,285 |
| 2022 | $1,621 | $24,640 | $5,355 | $19,285 |
| 2021 | $1,659 | $24,640 | $5,355 | $19,285 |
| 2020 | $1,569 | $20,475 | $4,410 | $16,065 |
| 2019 | $1,526 | $20,475 | $4,410 | $16,065 |
| 2018 | $858 | $20,475 | $4,410 | $16,065 |
| 2017 | $961 | $20,580 | $4,585 | $15,995 |
| 2016 | $966 | $58,800 | $13,100 | $45,700 |
| 2015 | $959 | $58,800 | $13,100 | $45,700 |
| 2014 | $839 | $22,090 | $4,590 | $17,500 |
| 2013 | $839 | $22,090 | $4,590 | $17,500 |
Source: Public Records
Map
Nearby Homes