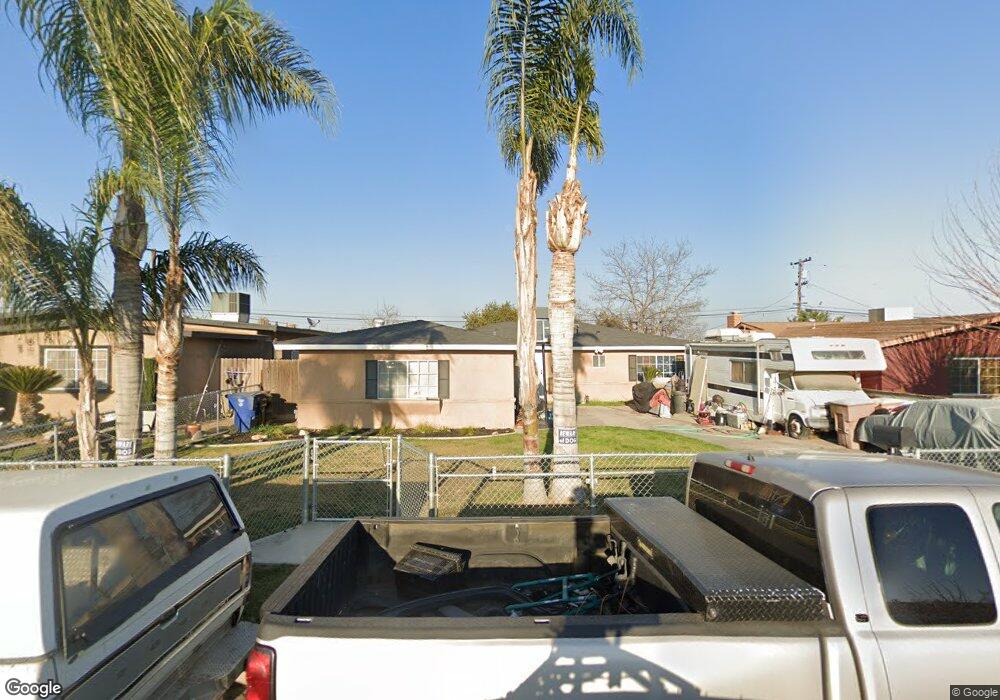
2824 Dore Dr Bakersfield, CA 93304
Wible Orchard NeighborhoodEstimated Value: $290,427 - $322,000
3
Beds
2
Baths
1,381
Sq Ft
$221/Sq Ft
Est. Value
About This Home
This home is located at 2824 Dore Dr, Bakersfield, CA 93304 and is currently estimated at $305,857, approximately $221 per square foot. 2824 Dore Dr is a home located in Kern County with nearby schools including Wayside Elementary School, Sequoia Middle School, and South High School.
Ownership History
Date
Name
Owned For
Owner Type
Purchase Details
Closed on
Sep 10, 2001
Sold by
Fite Inez Williams and Elmer Stinson Trust
Bought by
Fite Inez Williams
Current Estimated Value
Purchase Details
Closed on
Jun 8, 2001
Sold by
Browden Shirley
Bought by
Browden Raquel Stinson and Browden Gravell Dwayne
Purchase Details
Closed on
Mar 26, 1999
Sold by
Stinson Elmer
Bought by
The Elmer Stinson Trust
Purchase Details
Closed on
Jan 20, 1999
Sold by
Stinson Elmer
Bought by
Browden Shirley
Purchase Details
Closed on
Aug 3, 1998
Sold by
Stinson Raquel Elish
Bought by
Stinson Elmer
Purchase Details
Closed on
Apr 24, 1998
Sold by
Stinson Elmer
Bought by
Stinson Raquel
Purchase Details
Closed on
Nov 7, 1996
Sold by
Bowers Meka Rochea
Bought by
Stinson Elmer
Home Financials for this Owner
Home Financials are based on the most recent Mortgage that was taken out on this home.
Original Mortgage
$53,118
Interest Rate
7.91%
Mortgage Type
FHA
Create a Home Valuation Report for This Property
The Home Valuation Report is an in-depth analysis detailing your home's value as well as a comparison with similar homes in the area
Home Values in the Area
Average Home Value in this Area
Purchase History
| Date | Buyer | Sale Price | Title Company |
|---|---|---|---|
| Fite Inez Williams | -- | -- | |
| Browden Raquel Stinson | -- | -- | |
| The Elmer Stinson Trust | -- | -- | |
| Browden Shirley | -- | -- | |
| Stinson Elmer | -- | -- | |
| Stinson Raquel | -- | -- | |
| Stinson Elmer | $53,000 | Fidelity National Title Co |
Source: Public Records
Mortgage History
| Date | Status | Borrower | Loan Amount |
|---|---|---|---|
| Previous Owner | Stinson Elmer | $53,118 |
Source: Public Records
Tax History
| Year | Tax Paid | Tax Assessment Tax Assessment Total Assessment is a certain percentage of the fair market value that is determined by local assessors to be the total taxable value of land and additions on the property. | Land | Improvement |
|---|---|---|---|---|
| 2025 | $1,697 | $85,801 | $29,302 | $56,499 |
| 2024 | $1,656 | $84,120 | $28,728 | $55,392 |
| 2023 | $1,656 | $82,471 | $28,165 | $54,306 |
| 2022 | $1,606 | $80,855 | $27,613 | $53,242 |
| 2021 | $1,506 | $79,271 | $27,072 | $52,199 |
| 2020 | $1,471 | $78,459 | $26,795 | $51,664 |
| 2019 | $1,443 | $78,459 | $26,795 | $51,664 |
| 2018 | $1,413 | $75,413 | $25,755 | $49,658 |
| 2017 | $1,403 | $73,935 | $25,250 | $48,685 |
| 2016 | $1,306 | $72,486 | $24,755 | $47,731 |
| 2015 | $1,295 | $71,399 | $24,384 | $47,015 |
| 2014 | $1,254 | $70,002 | $23,907 | $46,095 |
Source: Public Records
Map
Nearby Homes
- 2709 Dore Dr
- 2612 Lee Dr
- 3000 S Chester Ave Unit SPC 46
- 3000 S Chester Ave Unit 12
- 3000 S Chester Ave Unit 53
- 3000 S Chester Ave Unit 104
- 2709 Lee Dr
- 2909 S Chester Ave
- 3105 Dore Dr
- 2612 S Chester Ave
- 3212 Timothy St
- 3201 Parkland Ct
- 2709 Laurel Dr
- 3463 Michelaine Ave
- 3212 S P St
- 3601 S Chester Ave Unit 56
- 3601 S Chester Ave Unit 1
- 1016 Meredith Dr
Your Personal Tour Guide
Ask me questions while you tour the home.