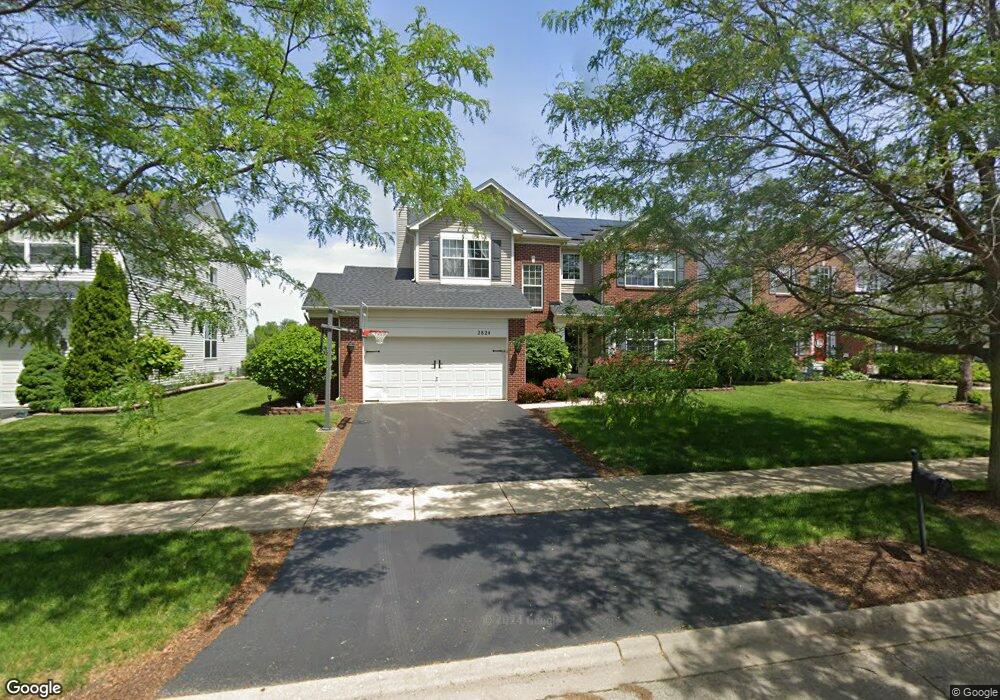
2824 Rourke Dr Aurora, IL 60503
Far Southeast NeighborhoodEstimated Value: $522,703 - $541,000
5
Beds
4
Baths
2,570
Sq Ft
$206/Sq Ft
Est. Value
About This Home
This home is located at 2824 Rourke Dr, Aurora, IL 60503 and is currently estimated at $530,426, approximately $206 per square foot. 2824 Rourke Dr is a home located in Kendall County with nearby schools including Wolfs Crossing Elementary School, Bednarcik Jr. High School, and Oswego East High School.
Ownership History
Date
Name
Owned For
Owner Type
Purchase Details
Closed on
May 11, 2017
Sold by
Anderson Aaron J and Anderson Nichole L
Bought by
Alfaro Lima Jose A and Aguilar Jaqueline E
Current Estimated Value
Home Financials for this Owner
Home Financials are based on the most recent Mortgage that was taken out on this home.
Original Mortgage
$333,841
Interest Rate
3.75%
Mortgage Type
FHA
Purchase Details
Closed on
Oct 12, 2004
Sold by
The Ryland Group Inc
Bought by
Anderson Aaron J and Anderson Nichole L
Home Financials for this Owner
Home Financials are based on the most recent Mortgage that was taken out on this home.
Original Mortgage
$266,372
Interest Rate
4.37%
Mortgage Type
Purchase Money Mortgage
Create a Home Valuation Report for This Property
The Home Valuation Report is an in-depth analysis detailing your home's value as well as a comparison with similar homes in the area
Home Values in the Area
Average Home Value in this Area
Purchase History
| Date | Buyer | Sale Price | Title Company |
|---|---|---|---|
| Alfaro Lima Jose A | $340,000 | First American Title | |
| Anderson Aaron J | $333,000 | First American Title Ins Co |
Source: Public Records
Mortgage History
| Date | Status | Borrower | Loan Amount |
|---|---|---|---|
| Previous Owner | Alfaro Lima Jose A | $333,841 | |
| Previous Owner | Anderson Aaron J | $266,372 | |
| Closed | Anderson Aaron J | $33,296 |
Source: Public Records
Tax History
| Year | Tax Paid | Tax Assessment Tax Assessment Total Assessment is a certain percentage of the fair market value that is determined by local assessors to be the total taxable value of land and additions on the property. | Land | Improvement |
|---|---|---|---|---|
| 2024 | $12,007 | $141,148 | $30,348 | $110,800 |
| 2023 | $10,828 | $124,910 | $26,857 | $98,053 |
| 2022 | $10,828 | $113,554 | $24,415 | $89,139 |
| 2021 | $10,573 | $107,126 | $23,033 | $84,093 |
| 2020 | $10,264 | $103,006 | $22,147 | $80,859 |
| 2019 | $10,417 | $102,205 | $22,147 | $80,058 |
| 2018 | $9,596 | $94,739 | $20,529 | $74,210 |
| 2017 | $9,328 | $87,721 | $19,008 | $68,713 |
| 2016 | $9,081 | $84,347 | $18,277 | $66,070 |
| 2015 | $9,223 | $81,891 | $17,745 | $64,146 |
| 2014 | -- | $77,256 | $16,741 | $60,515 |
| 2013 | -- | $78,036 | $16,910 | $61,126 |
Source: Public Records
Map
Nearby Homes
- 652 Hawley Dr Unit 4383
- 2566 Rourke Dr
- 3017 Lundquist Dr
- 2263 Shiloh Dr Unit 2
- 2413 Dickens Dr
- 1893 Indian Hill Ln Unit 4053
- 2197 Wilson Creek Cir Unit 3
- 1851 Indian Hill Ln Unit 4083
- 1823 Indian Hill Ln Unit 4102
- 2812 Stuart Kaplan Ct
- 2326 Sunshine Ln Unit 1969
- 2125 Sunrise Cir Unit 27
- 1769 Baler Ave
- 3328 Fulshear Cir
- 3237 Peyton Cir
- 3235 Kimblewick Cir
- 3302 Wildlight Rd
- 2357 Twilight Dr
- 3146 Peyton Cir
- 3134 Peyton Cir
- 2834 Rourke Dr
- 2814 Rourke Dr
- 2804 Rourke Dr
- 2844 Rourke Dr
- 2854 Rourke Dr
- 2794 Rourke Dr
- 2833 Rourke Dr
- 2823 Rourke Dr
- 2768 Fort Sumter Ct
- 2843 Rourke Dr
- 2813 Rourke Dr
- 2864 Rourke Dr
- 2853 Rourke Dr
- 2767 Fort Sumter Ct
- 2803 Rourke Dr
- 2784 Rourke Dr
- 2863 Rourke Dr
- 2793 Rourke Dr
- 2874 Rourke Dr
- 2756 Fort Sumter Ct