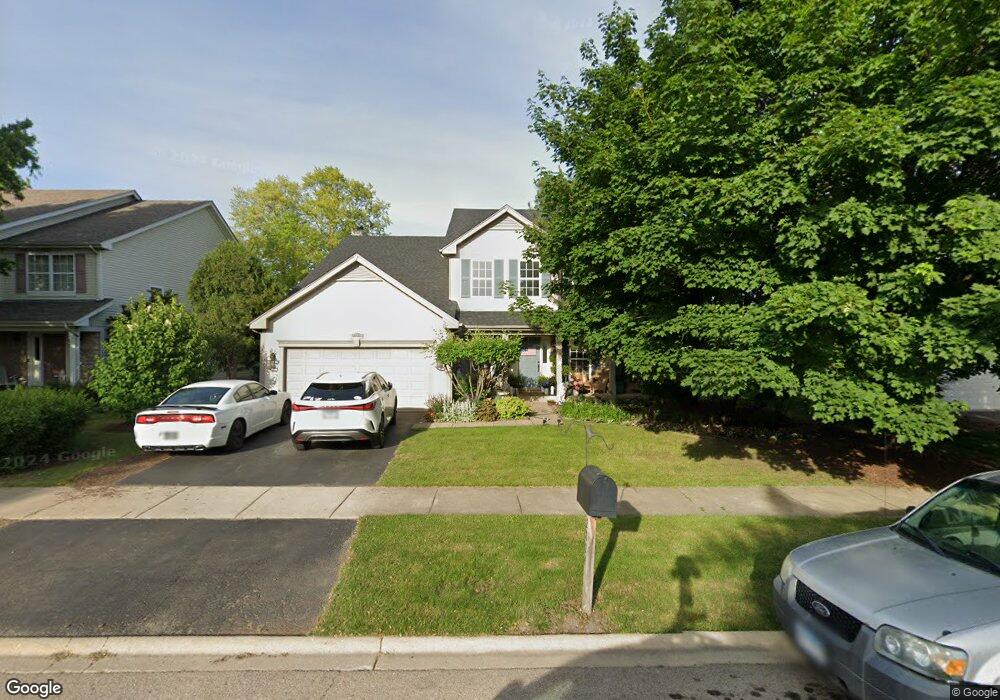
2824 Stuart Kaplan Ct Aurora, IL 60503
Far Southeast NeighborhoodEstimated Value: $519,000 - $551,000
4
Beds
3
Baths
3,798
Sq Ft
$139/Sq Ft
Est. Value
About This Home
This home is located at 2824 Stuart Kaplan Ct, Aurora, IL 60503 and is currently estimated at $529,763, approximately $139 per square foot. 2824 Stuart Kaplan Ct is a home located in Will County with nearby schools including Wolfs Crossing Elementary School, Bednarcik Jr. High School, and Oswego East High School.
Ownership History
Date
Name
Owned For
Owner Type
Purchase Details
Closed on
Mar 24, 2005
Sold by
Howell Candace Y
Bought by
Egofske Thomas and Egosfke Josephine
Current Estimated Value
Home Financials for this Owner
Home Financials are based on the most recent Mortgage that was taken out on this home.
Original Mortgage
$260,800
Outstanding Balance
$121,236
Interest Rate
4.37%
Mortgage Type
Fannie Mae Freddie Mac
Estimated Equity
$408,527
Purchase Details
Closed on
Oct 31, 2002
Sold by
Hill Ronald C and Hill Janice C
Bought by
Howell Candace Y
Home Financials for this Owner
Home Financials are based on the most recent Mortgage that was taken out on this home.
Original Mortgage
$248,000
Interest Rate
6.38%
Purchase Details
Closed on
Aug 7, 2001
Sold by
Gmac Model Home Finance Inc
Bought by
Hill Ronald C and Hill Janice C
Home Financials for this Owner
Home Financials are based on the most recent Mortgage that was taken out on this home.
Original Mortgage
$260,500
Interest Rate
5%
Create a Home Valuation Report for This Property
The Home Valuation Report is an in-depth analysis detailing your home's value as well as a comparison with similar homes in the area
Home Values in the Area
Average Home Value in this Area
Purchase History
| Date | Buyer | Sale Price | Title Company |
|---|---|---|---|
| Egofske Thomas | $326,000 | -- | |
| Howell Candace Y | $310,000 | -- | |
| Hill Ronald C | $332,500 | Chicago Title Insurance Co |
Source: Public Records
Mortgage History
| Date | Status | Borrower | Loan Amount |
|---|---|---|---|
| Open | Egofske Thomas | $260,800 | |
| Previous Owner | Howell Candace Y | $248,000 | |
| Previous Owner | Hill Ronald C | $260,500 |
Source: Public Records
Tax History
| Year | Tax Paid | Tax Assessment Tax Assessment Total Assessment is a certain percentage of the fair market value that is determined by local assessors to be the total taxable value of land and additions on the property. | Land | Improvement |
|---|---|---|---|---|
| 2024 | $14,495 | $174,297 | $23,259 | $151,038 |
| 2023 | $14,495 | $153,973 | $20,547 | $133,426 |
| 2022 | $12,124 | $127,826 | $19,437 | $108,389 |
| 2021 | $12,056 | $121,739 | $18,511 | $103,228 |
| 2020 | $11,544 | $119,810 | $18,218 | $101,592 |
| 2019 | $11,670 | $116,434 | $17,705 | $98,729 |
| 2018 | $10,574 | $102,647 | $17,315 | $85,332 |
| 2017 | $10,466 | $99,997 | $16,868 | $83,129 |
| 2016 | $10,734 | $97,845 | $16,505 | $81,340 |
| 2015 | $11,317 | $94,082 | $15,870 | $78,212 |
| 2014 | $11,317 | $92,250 | $15,870 | $76,380 |
| 2013 | $11,317 | $92,250 | $15,870 | $76,380 |
Source: Public Records
Map
Nearby Homes
- 2812 Stuart Kaplan Ct
- 2799 Squaw Valley Trail
- 2811 Imperial Valley Trail
- 2722 Lahinch Dr
- 2969 Francis Ct
- 2322 Pagosa Springs Dr
- 9836 S Carls Dr
- 3203 Sweetgrass Cir
- 10140 S Eola Rd
- 3017 Lundquist Dr
- 3154 Adelwood Dr
- 3150 Adelwood Cir
- 3106 Adelwood Cir
- 3152 Adelwood Cir
- 2327 Georgetown Cir Unit 18/4
- 3146 Bellwether Dr
- 3144 Bellwether Dr
- 3148 Bellwether Dr
- 3152 Bellwether Dr
- 3144 Peyton Cir
- 2812 Stuart Kaplan Ct
- 2836 Stuart Kaplan Ct
- 2800 Stuart Kaplan Dr Unit 1
- 2848 Stuart Kaplan Ct Unit 1
- 2813 Stuart Kaplan Ct
- 2825 Stuart Kaplan Ct Unit 1
- 2837 Stuart Kaplan Ct
- 2792 Stuart Kaplan Dr
- 2860 Stuart Kaplan Ct Unit 1
- 2809 Carlsbad Cir Unit 4
- 2849 Stuart Kaplan Ct Unit 1
- 2821 Carlsbad Cir
- 2801 Carlsbad Cir Unit 4
- 2799 Stuart Kaplan Dr
- 2601 Smithfield Ln
- 2861 Stuart Kaplan Ct
- 2872 Stuart Kaplan Ct
- 2789 Stuart Kaplan Dr
- 2797 Carlsbad Cir
- 2784 Stuart Kaplan Dr
Your Personal Tour Guide
Ask me questions while you tour the home.