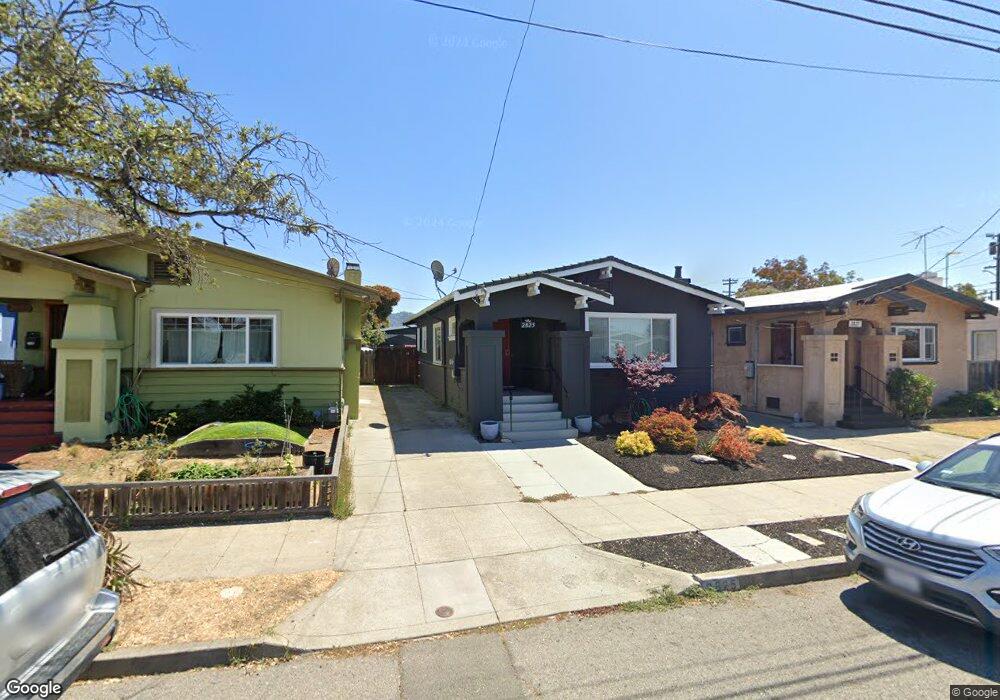
2825 Acton St Berkeley, CA 94702
West Berkeley NeighborhoodEstimated Value: $1,062,000 - $1,362,000
2
Beds
1
Bath
1,165
Sq Ft
$990/Sq Ft
Est. Value
About This Home
This home is located at 2825 Acton St, Berkeley, CA 94702 and is currently estimated at $1,152,847, approximately $989 per square foot. 2825 Acton St is a home located in Alameda County with nearby schools including Malcolm X Elementary School, Washington Elementary School, and Oxford Elementary School.
Ownership History
Date
Name
Owned For
Owner Type
Purchase Details
Closed on
Dec 17, 2009
Sold by
Johnson Linda L and The Katherine H Edmond Trust
Bought by
Johnson Genell L
Current Estimated Value
Purchase Details
Closed on
Sep 11, 2000
Sold by
Edmond Katherine H
Bought by
Edmond Katherine H and The Katherine H Edmond Living
Create a Home Valuation Report for This Property
The Home Valuation Report is an in-depth analysis detailing your home's value as well as a comparison with similar homes in the area
Home Values in the Area
Average Home Value in this Area
Purchase History
| Date | Buyer | Sale Price | Title Company |
|---|---|---|---|
| Johnson Genell L | -- | None Available | |
| Edmond Katherine H | -- | -- |
Source: Public Records
Tax History
| Year | Tax Paid | Tax Assessment Tax Assessment Total Assessment is a certain percentage of the fair market value that is determined by local assessors to be the total taxable value of land and additions on the property. | Land | Improvement |
|---|---|---|---|---|
| 2025 | $9,759 | $572,451 | $173,835 | $405,616 |
| 2024 | $9,759 | $561,093 | $170,428 | $397,665 |
| 2023 | $9,493 | $556,955 | $167,086 | $389,869 |
| 2022 | $9,255 | $539,038 | $163,811 | $382,227 |
| 2021 | $9,693 | $528,333 | $160,600 | $374,733 |
| 2020 | $8,792 | $529,847 | $158,954 | $370,893 |
| 2019 | $8,458 | $519,461 | $155,838 | $363,623 |
| 2018 | $8,300 | $509,277 | $152,783 | $356,494 |
| 2017 | $7,995 | $499,292 | $149,787 | $349,505 |
| 2016 | $7,729 | $489,504 | $146,851 | $342,653 |
| 2015 | $7,617 | $482,156 | $144,647 | $337,509 |
| 2014 | $7,551 | $472,715 | $141,814 | $330,901 |
Source: Public Records
Map
Nearby Homes
- 2922 Stanton St
- 1314 Ashby Ave
- 2790 Sacramento St
- 1237 Ashby Ave
- 2782 Sacramento St
- 2774 Sacramento St
- 2758 Sacramento St
- 3032 Mabel St
- 1450 Ward St
- 2750 Sacramento St
- 1535 Julia St
- 2751 Wallace St
- 1530 Stuart St
- 1507 Prince St
- 2747 San Pablo Ave Unit 507
- 3101 Sacramento St
- 1080 67th St
- 1515 Derby St
- 6628 Helen Ct
- 1034 Grayson St
Your Personal Tour Guide
Ask me questions while you tour the home.