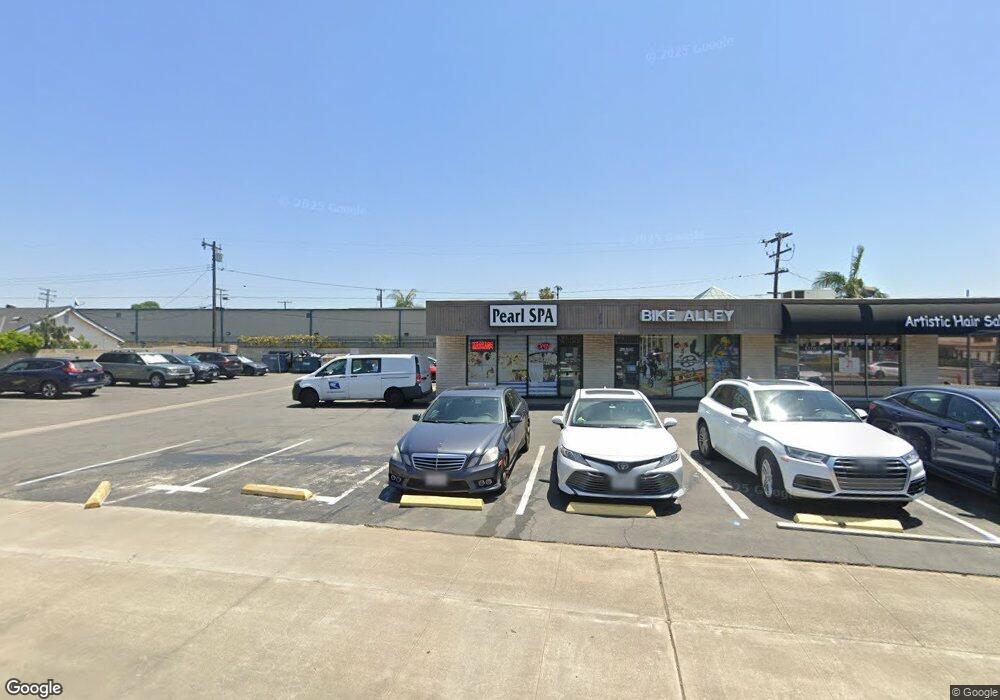
2825 E Chapman Ave Orange, CA 92869
Estimated Value: $3,508,265
Studio
--
Bath
5,809
Sq Ft
$604/Sq Ft
Est. Value
About This Home
This home is located at 2825 E Chapman Ave, Orange, CA 92869 and is currently estimated at $3,508,265, approximately $603 per square foot. 2825 E Chapman Ave is a home located in Orange County with nearby schools including Prospect Elementary School, El Modena High School, and Orange County Classical Academy.
Ownership History
Date
Name
Owned For
Owner Type
Purchase Details
Closed on
May 10, 2018
Sold by
S S K Properties
Bought by
Cary Investment Inc
Current Estimated Value
Purchase Details
Closed on
Apr 17, 2012
Sold by
S S K K
Bought by
S S K Properties
Purchase Details
Closed on
Apr 14, 2004
Sold by
Moreno Francisco
Bought by
Villa Florentino
Create a Home Valuation Report for This Property
The Home Valuation Report is an in-depth analysis detailing your home's value as well as a comparison with similar homes in the area
Home Values in the Area
Average Home Value in this Area
Purchase History
| Date | Buyer | Sale Price | Title Company |
|---|---|---|---|
| Cary Investment Inc | $2,300,000 | Chicago Title Co | |
| S S K Properties | -- | North American Title Company | |
| Villa Florentino | -- | -- |
Source: Public Records
Mortgage History
| Date | Status | Borrower | Loan Amount |
|---|---|---|---|
| Closed | Cary Investment Inc | $0 |
Source: Public Records
Tax History
| Year | Tax Paid | Tax Assessment Tax Assessment Total Assessment is a certain percentage of the fair market value that is determined by local assessors to be the total taxable value of land and additions on the property. | Land | Improvement |
|---|---|---|---|---|
| 2025 | $31,790 | $2,592,945 | $2,231,038 | $361,907 |
| 2024 | $31,790 | $2,542,103 | $2,187,292 | $354,811 |
| 2023 | $30,767 | $2,466,064 | $2,144,404 | $321,660 |
| 2022 | $30,134 | $2,417,710 | $2,102,357 | $315,353 |
| 2021 | $29,347 | $2,370,304 | $2,061,134 | $309,170 |
| 2020 | $29,069 | $2,346,000 | $2,040,000 | $306,000 |
| 2019 | $28,742 | $2,300,000 | $2,000,000 | $300,000 |
| 2018 | $11,349 | $652,913 | $535,360 | $117,553 |
| 2017 | $10,997 | $640,111 | $524,862 | $115,249 |
| 2016 | $10,813 | $627,560 | $514,570 | $112,990 |
| 2015 | $10,653 | $618,134 | $506,841 | $111,293 |
| 2014 | $10,436 | $606,026 | $496,913 | $109,113 |
Source: Public Records
Map
Nearby Homes
- 3139 E Chapman Ave Unit 3B
- 244 S Violet Ln
- 2720 E Walnut Ave Unit 73
- 3406 E Lochleven Ln Unit B
- 279 N Sacramento St
- 448 N Londonderry Ln Unit D
- 2705 E Orange Grove Ave
- 369 S Jennifer Ln
- 466 S Wellington Rd
- 3801 E Spring St
- 2929 E Hamilton Ave
- 478 N Swidler St
- 338 S James St
- 605 N Pageant Dr Unit B
- 692 N Adele St Unit 50
- 692 N Adele St Unit 78
- 3527 E Barrington Dr
- 547 S Yorba St
- 3030 E Elgin Place
- 629 S Yorba St
- 141 N Malena Dr
- 153 N Malena Dr
- 2746 E Bennett Ave
- 165 N Malena Dr
- 132 N Malena Dr Unit D
- 132 N Malena Dr
- 131 N Mcpherson Rd Unit B
- 131 N Mcpherson Rd
- 133 N Mcpherson Rd
- 2923 E Pearl Ave
- 175 N Malena Dr
- 2744 E Bennett Ave
- 2934 E Pearl Ave
- 2925 E Pearl Ave
- 2927 E Pearl Ave
- 2747 E Bennett Ave
- 2929 E Pearl Ave
- 2745 E Chapman Ave
- 2942 E Pearl Ave
- 2943 E Pearl Ave
Your Personal Tour Guide
Ask me questions while you tour the home.