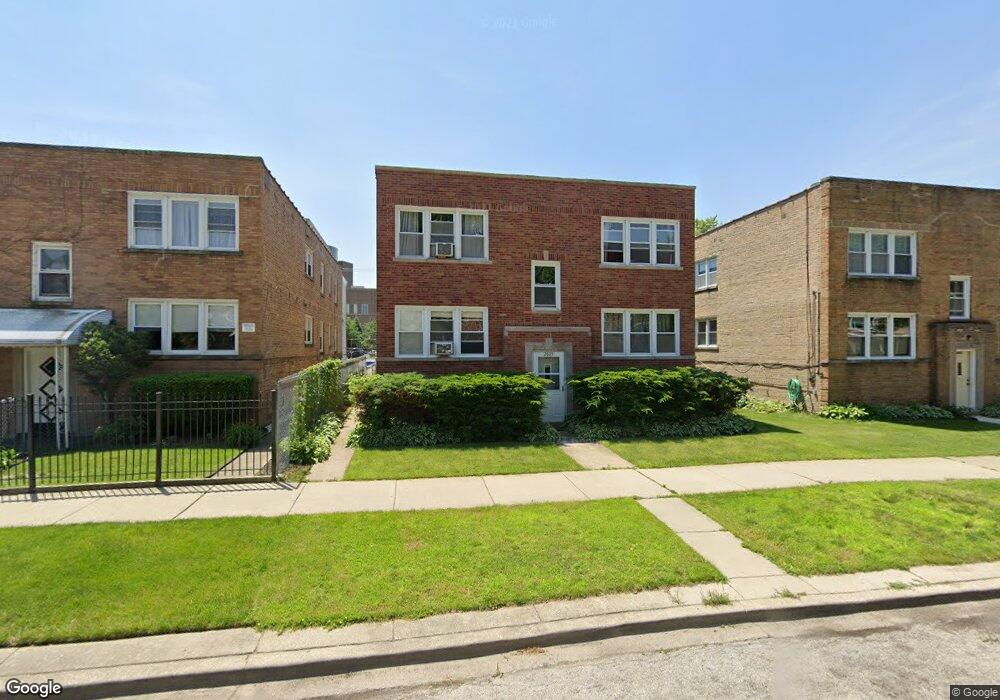
2825 W Farragut Ave Unit 1E Chicago, IL 60625
Lincoln Square NeighborhoodEstimated Value: $193,000 - $289,000
--
Bed
--
Bath
6,642
Sq Ft
$36/Sq Ft
Est. Value
About This Home
This home is located at 2825 W Farragut Ave Unit 1E, Chicago, IL 60625 and is currently estimated at $236,877, approximately $35 per square foot. 2825 W Farragut Ave Unit 1E is a home located in Cook County with nearby schools including Budlong Elementary School, Amundsen High School, and North Shore Adventist Academy.
Ownership History
Date
Name
Owned For
Owner Type
Purchase Details
Closed on
May 3, 2007
Sold by
Serna Ana I and Bedoya Ana I
Bought by
Bedoya Ana I
Current Estimated Value
Home Financials for this Owner
Home Financials are based on the most recent Mortgage that was taken out on this home.
Original Mortgage
$165,000
Outstanding Balance
$100,911
Interest Rate
6.27%
Mortgage Type
New Conventional
Estimated Equity
$135,966
Purchase Details
Closed on
Jul 15, 2004
Sold by
Betshlimon Amanoel
Bought by
Serna Ana I
Home Financials for this Owner
Home Financials are based on the most recent Mortgage that was taken out on this home.
Original Mortgage
$152,150
Interest Rate
6.42%
Mortgage Type
Purchase Money Mortgage
Purchase Details
Closed on
Dec 27, 1994
Sold by
Betshlimon Wedad
Bought by
Betshlimon Amanoel
Create a Home Valuation Report for This Property
The Home Valuation Report is an in-depth analysis detailing your home's value as well as a comparison with similar homes in the area
Home Values in the Area
Average Home Value in this Area
Purchase History
| Date | Buyer | Sale Price | Title Company |
|---|---|---|---|
| Bedoya Ana I | -- | Lawyers | |
| Serna Ana I | $179,000 | Heritage Title Company | |
| Betshlimon Amanoel | -- | -- |
Source: Public Records
Mortgage History
| Date | Status | Borrower | Loan Amount |
|---|---|---|---|
| Open | Bedoya Ana I | $165,000 | |
| Closed | Serna Ana I | $152,150 |
Source: Public Records
Tax History Compared to Growth
Tax History
| Year | Tax Paid | Tax Assessment Tax Assessment Total Assessment is a certain percentage of the fair market value that is determined by local assessors to be the total taxable value of land and additions on the property. | Land | Improvement |
|---|---|---|---|---|
| 2024 | $2,593 | $16,240 | $4,977 | $11,263 |
| 2023 | $2,506 | $15,606 | $4,032 | $11,574 |
| 2022 | $2,506 | $15,606 | $4,032 | $11,574 |
| 2021 | $2,469 | $15,606 | $4,032 | $11,574 |
| 2020 | $2,902 | $16,131 | $2,394 | $13,737 |
| 2019 | $2,918 | $17,953 | $2,394 | $15,559 |
| 2018 | $2,868 | $17,953 | $2,394 | $15,559 |
| 2017 | $1,839 | $11,919 | $2,142 | $9,777 |
| 2016 | $1,887 | $11,919 | $2,142 | $9,777 |
| 2015 | $1,703 | $11,919 | $2,142 | $9,777 |
| 2014 | $2,451 | $15,777 | $1,890 | $13,887 |
| 2013 | $3,108 | $19,721 | $1,890 | $17,831 |
Source: Public Records
Map
Nearby Homes
- 2829 W Farragut Ave Unit 2E
- 2900 W Foster Ave
- 2745 W Berwyn Ave
- 2710 W Summerdale Ave Unit GA
- 2700 W Carmen Ave
- 2712 W Balmoral Ave Unit 2E
- 2700 W Balmoral Ave
- 2946 W Balmoral Ave
- 5220 N Rockwell St Unit 1S
- 2601 W Foster Ave Unit 3S
- 4946 N Mozart St
- 2521 W Farragut Ave
- 2607 W Carmen Ave
- 2531 W Berwyn Ave Unit G
- 5501 N California Ave Unit 1N
- 5250 N Lincoln Ave Unit 3C
- 5300 N Lincoln Ave Unit 4E
- 2637 W Catalpa Ave
- 2626 W Catalpa Ave Unit 21
- 2910 W Gregory St
- 2825 W Farragut Ave Unit 2E
- 2825 W Farragut Ave Unit 2W
- 2825 W Farragut Ave Unit 1W
- 2821 W Farragut Ave Unit 1W
- 2821 W Farragut Ave Unit GB
- 2821 W Farragut Ave Unit 1E
- 2821 W Farragut Ave
- 2829 W Farragut Ave Unit 1E
- 2829 W Farragut Ave Unit 2W
- 2829 W Farragut Ave Unit 1W
- 2829 W Farragut Ave Unit 1
- 2815 W Farragut Ave Unit 1W
- 2815 W Farragut Ave Unit 2W
- 2815 W Farragut Ave Unit 2E
- 2815 W Farragut Ave Unit 1E
- 2833 W Farragut Ave Unit 1W
- 2833 W Farragut Ave Unit 2W
- 2833 W Farragut Ave Unit 1E
- 2833 W Farragut Ave Unit 2E
- 2841 W Farragut Ave