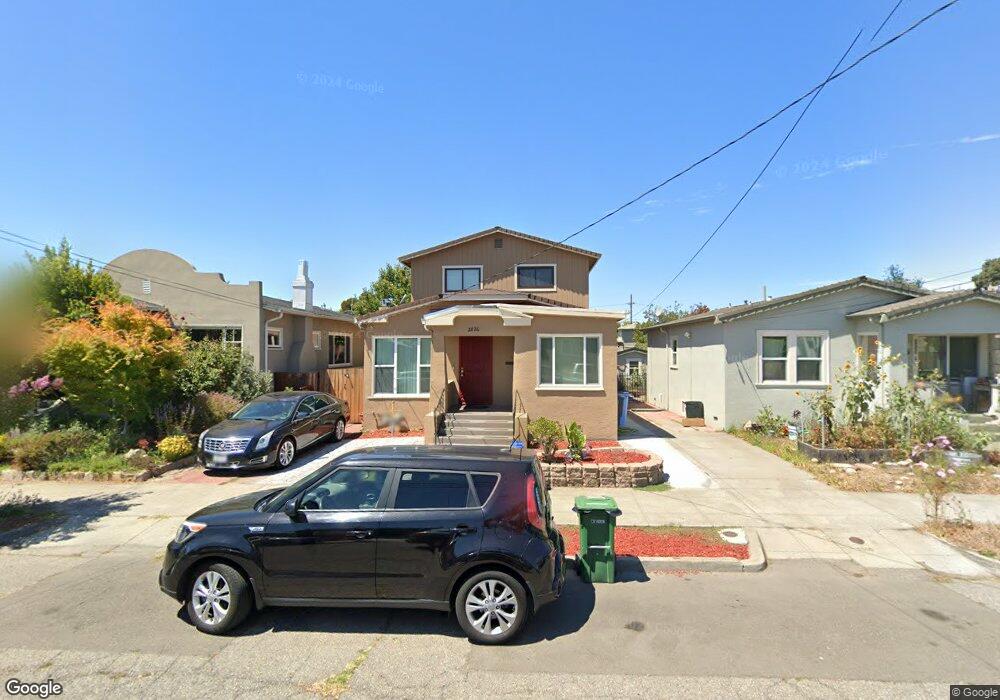
2826 Acton St Berkeley, CA 94702
West Berkeley NeighborhoodEstimated Value: $1,275,000 - $2,080,000
4
Beds
3
Baths
1,696
Sq Ft
$917/Sq Ft
Est. Value
About This Home
This home is located at 2826 Acton St, Berkeley, CA 94702 and is currently estimated at $1,554,535, approximately $916 per square foot. 2826 Acton St is a home located in Alameda County with nearby schools including Malcolm X Elementary School, Washington Elementary School, and Oxford Elementary School.
Ownership History
Date
Name
Owned For
Owner Type
Purchase Details
Closed on
Aug 22, 2017
Sold by
Lee Morris Patricia Ann and The Gerard Morris Revocable Tr
Bought by
Lee Morris Patricia Ann
Current Estimated Value
Purchase Details
Closed on
Jan 26, 2017
Sold by
Morris Gerard
Bought by
Morris Gerard and The Gerard Morris Revocable Tr
Purchase Details
Closed on
Jan 10, 2017
Sold by
Morris Gerard
Bought by
Morris Gerard and Lee Morris Patricia
Purchase Details
Closed on
May 26, 2015
Sold by
Morris Gerard and Lee Morris Patricia
Bought by
Morris Gerard
Home Financials for this Owner
Home Financials are based on the most recent Mortgage that was taken out on this home.
Original Mortgage
$900,000
Outstanding Balance
$663,336
Interest Rate
2.93%
Mortgage Type
Reverse Mortgage Home Equity Conversion Mortgage
Estimated Equity
$891,199
Purchase Details
Closed on
Dec 26, 2013
Sold by
Lee Morris Patricia
Bought by
Morris Gerard
Home Financials for this Owner
Home Financials are based on the most recent Mortgage that was taken out on this home.
Original Mortgage
$86,000
Interest Rate
4.17%
Mortgage Type
New Conventional
Purchase Details
Closed on
Oct 24, 2013
Sold by
Morris Gerard
Bought by
Morris Gerard and Lee Morris Patricia
Purchase Details
Closed on
Jul 23, 2013
Sold by
Morris Gerard and Morris Geard
Bought by
Morris Gerard
Home Financials for this Owner
Home Financials are based on the most recent Mortgage that was taken out on this home.
Original Mortgage
$61,000
Interest Rate
3.98%
Mortgage Type
New Conventional
Purchase Details
Closed on
Jun 26, 1997
Sold by
Morris Shirley A
Bought by
Morris Sammie Leroy
Create a Home Valuation Report for This Property
The Home Valuation Report is an in-depth analysis detailing your home's value as well as a comparison with similar homes in the area
Home Values in the Area
Average Home Value in this Area
Purchase History
| Date | Buyer | Sale Price | Title Company |
|---|---|---|---|
| Lee Morris Patricia Ann | -- | None Available | |
| Morris Gerard | -- | None Available | |
| Morris Gerard | -- | None Available | |
| Morris Gerard | -- | None Available | |
| Morris Gerard | $200,000 | None Available | |
| Morris Gerard | -- | Old Republic Title Company | |
| Morris Gerard | $43,000 | Old Republic Title Company | |
| Morris Gerard | -- | None Available | |
| Morris Gerard | -- | North American Title Company | |
| Morris Sammie Leroy | -- | -- | |
| Morris Sammie Leroy | -- | -- | |
| Morris Sammie | -- | -- |
Source: Public Records
Mortgage History
| Date | Status | Borrower | Loan Amount |
|---|---|---|---|
| Open | Morris Gerard | $900,000 | |
| Closed | Morris Gerard | $86,000 | |
| Previous Owner | Morris Gerard | $61,000 |
Source: Public Records
Tax History
| Year | Tax Paid | Tax Assessment Tax Assessment Total Assessment is a certain percentage of the fair market value that is determined by local assessors to be the total taxable value of land and additions on the property. | Land | Improvement |
|---|---|---|---|---|
| 2025 | $13,613 | $395,727 | $116,797 | $285,930 |
| 2024 | $13,613 | $387,832 | $114,508 | $280,324 |
| 2023 | $13,430 | $387,092 | $112,263 | $274,829 |
| 2022 | $13,239 | $372,503 | $110,062 | $269,441 |
| 2021 | $13,227 | $365,065 | $107,905 | $264,160 |
| 2020 | $12,721 | $368,250 | $106,799 | $261,451 |
| 2019 | $12,332 | $361,032 | $104,705 | $256,327 |
| 2018 | $12,195 | $353,955 | $102,653 | $251,302 |
| 2017 | $11,830 | $337,212 | $100,640 | $236,572 |
| 2016 | $5,800 | $330,600 | $98,667 | $231,933 |
| 2015 | $5,710 | $325,636 | $97,185 | $228,451 |
| 2014 | $5,707 | $324,699 | $95,282 | $229,417 |
Source: Public Records
Map
Nearby Homes
- 2922 Stanton St
- 1314 Ashby Ave
- 2790 Sacramento St
- 1237 Ashby Ave
- 2782 Sacramento St
- 2774 Sacramento St
- 2758 Sacramento St
- 3032 Mabel St
- 1450 Ward St
- 2750 Sacramento St
- 1535 Julia St
- 2751 Wallace St
- 1530 Stuart St
- 1507 Prince St
- 2747 San Pablo Ave Unit 507
- 3101 Sacramento St
- 1080 67th St
- 1515 Derby St
- 6628 Helen Ct
- 1034 Grayson St
Your Personal Tour Guide
Ask me questions while you tour the home.