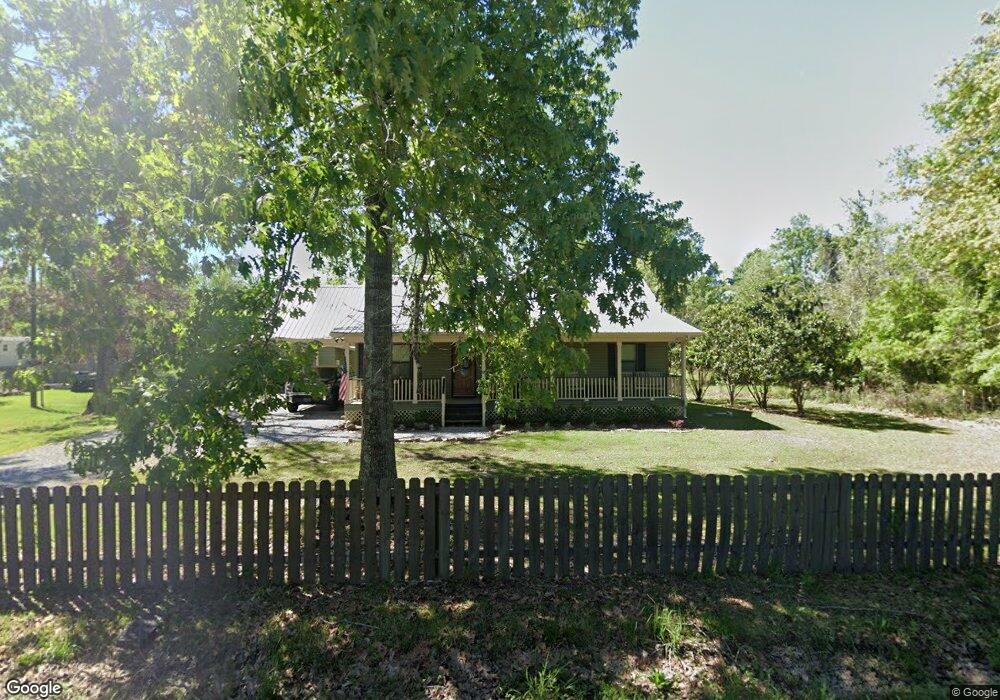
28268 S Sam Arnold Loop Ponchatoula, LA 70454
Estimated Value: $206,000 - $231,000
Studio
--
Bath
1,795
Sq Ft
$120/Sq Ft
Est. Value
About This Home
This home is located at 28268 S Sam Arnold Loop, Ponchatoula, LA 70454 and is currently estimated at $215,885, approximately $120 per square foot. 28268 S Sam Arnold Loop is a home with nearby schools including Champ Cooper Elementary School and Ponchatoula High School.
Ownership History
Date
Name
Owned For
Owner Type
Purchase Details
Closed on
May 12, 2021
Sold by
Sticker Jsutin E
Bought by
Windom Hunter D
Current Estimated Value
Home Financials for this Owner
Home Financials are based on the most recent Mortgage that was taken out on this home.
Original Mortgage
$174,747
Outstanding Balance
$156,670
Interest Rate
3.1%
Mortgage Type
Purchase Money Mortgage
Estimated Equity
$59,215
Purchase Details
Closed on
Dec 22, 2014
Sold by
Motichek Mark Joseph and Motichek Robin Anderson
Bought by
Sticker Justin Everett
Home Financials for this Owner
Home Financials are based on the most recent Mortgage that was taken out on this home.
Original Mortgage
$128,961
Interest Rate
4.01%
Mortgage Type
FHA
Purchase Details
Closed on
Nov 2, 2010
Sold by
Howell Kandi De Chelly Naramore
Bought by
Motichek Robin Diane and Motichek Mark Jospeh
Create a Home Valuation Report for This Property
The Home Valuation Report is an in-depth analysis detailing your home's value as well as a comparison with similar homes in the area
Home Values in the Area
Average Home Value in this Area
Purchase History
| Date | Buyer | Sale Price | Title Company |
|---|---|---|---|
| Windom Hunter D | $171,500 | None Available | |
| Sticker Justin Everett | $131,340 | Crescent Title Llc | |
| Motichek Robin Diane | -- | None Available |
Source: Public Records
Mortgage History
| Date | Status | Borrower | Loan Amount |
|---|---|---|---|
| Open | Windom Hunter D | $174,747 | |
| Previous Owner | Sticker Justin Everett | $128,961 |
Source: Public Records
Tax History
| Year | Tax Paid | Tax Assessment Tax Assessment Total Assessment is a certain percentage of the fair market value that is determined by local assessors to be the total taxable value of land and additions on the property. | Land | Improvement |
|---|---|---|---|---|
| 2025 | $1,424 | $14,143 | $3,240 | $10,903 |
| 2024 | $1,410 | $14,143 | $3,240 | $10,903 |
| 2023 | $1,406 | $13,903 | $3,000 | $10,903 |
| 2022 | $1,406 | $13,903 | $3,000 | $10,903 |
| 2021 | $653 | $13,903 | $3,000 | $10,903 |
| 2020 | $1,034 | $10,237 | $1,500 | $8,737 |
| 2019 | $1,032 | $10,237 | $1,500 | $8,737 |
| 2018 | $1,035 | $10,237 | $1,500 | $8,737 |
| 2017 | $1,035 | $10,237 | $1,500 | $8,737 |
| 2016 | $1,035 | $10,237 | $1,500 | $8,737 |
| 2015 | $278 | $10,237 | $1,500 | $8,737 |
| 2014 | $260 | $10,237 | $1,500 | $8,737 |
Source: Public Records
Map
Nearby Homes
- 28402 Rose Oak St
- 28651 Water Oak Loop
- 39616 Bedico Trace Blvd
- PD-3 Bedico Trace Blvd
- PD-4 Bedico Trace Blvd
- PD-2 Bedico Trace Blvd
- PD-1 Summer Ln
- 28155 Louisiana 22
- 28155 E Hwy 22 Other
- 28117 Loiret Ct
- 40078 Bornel Ct
- 40090 Maison Lafitte Blvd
- 28476 Loiret Ct
- 39795 Kelly Wood Blvd
- 39786 Stuart Ct
- 9 Adrienne St
- 28 Hester St
- 28621 Venette Ct
- 28294 S Sam Arnold Loop
- 28237 S Sam Arnold Loop
- 39674 Morse Cemetery Rd
- 39714 E Sam Arnold Loop
- 28230 S Sam Arnold Loop
- 39757 E Sam Arnold Loop
- 28340 Pritchard Ln
- 39649 Morse Cemetery Rd
- 28355 Pritchard Ln
- 39742 E Sam Arnold Loop None
- 39742 E Sam Arnold Loop
- 39767 E Sam Arnold Loop
- 39701 E Sam Arnold Loop
- 28184 S Sam Arnold Loop
- 39768 E Sam Arnold Loop
- 28193 S Sam Arnold Loop
- 39785 E Sam Arnold Loop
- 39805 E Sam Arnold Loop
- 39587 Morse Cemetery Rd
- 39778 E Sam Arnold Loop
Your Personal Tour Guide
Ask me questions while you tour the home.