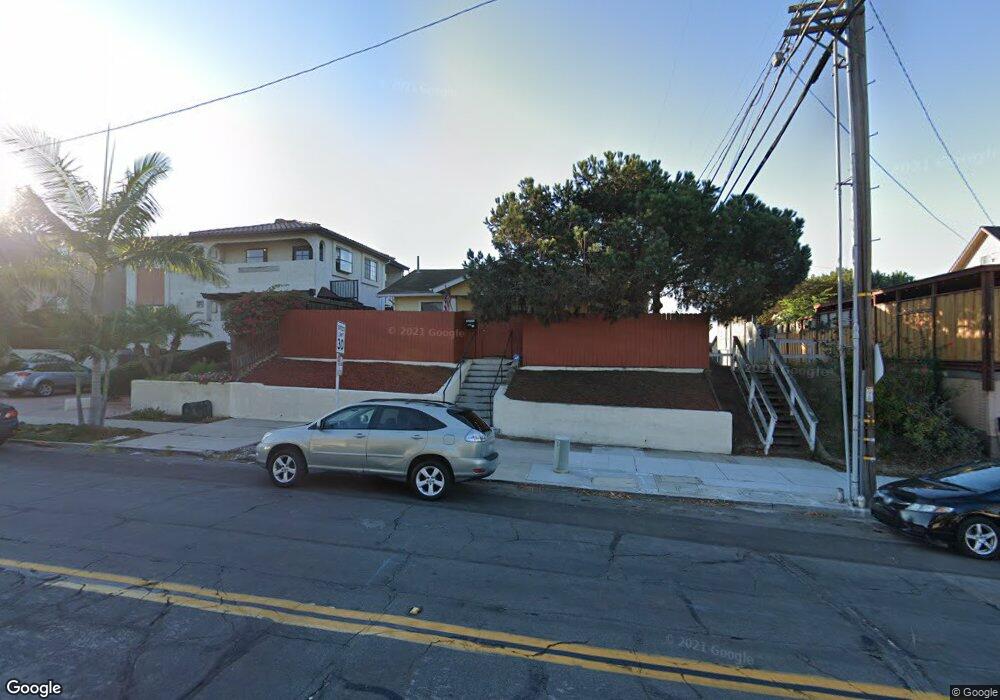
2827 C St San Diego, CA 92102
Golden Hill NeighborhoodEstimated Value: $1,212,000 - $1,497,000
3
Beds
1
Bath
1,084
Sq Ft
$1,258/Sq Ft
Est. Value
About This Home
This home is located at 2827 C St, San Diego, CA 92102 and is currently estimated at $1,364,100, approximately $1,258 per square foot. 2827 C St is a home located in San Diego County with nearby schools including Golden Hill Elementary School, Roosevelt International Middle School, and Albert Einstein Academy.
Ownership History
Date
Name
Owned For
Owner Type
Purchase Details
Closed on
Jul 27, 2023
Sold by
2827 C Street Llc
Bought by
Mig 2827 C St Llc
Current Estimated Value
Home Financials for this Owner
Home Financials are based on the most recent Mortgage that was taken out on this home.
Original Mortgage
$1,025,600
Outstanding Balance
$993,202
Interest Rate
5%
Mortgage Type
New Conventional
Estimated Equity
$370,898
Purchase Details
Closed on
Aug 27, 2021
Sold by
Davis William M
Bought by
2827 C Street Llc
Purchase Details
Closed on
Jul 17, 2019
Sold by
Davis William M and Marchetti Susan Leslie
Bought by
Davis William M
Home Financials for this Owner
Home Financials are based on the most recent Mortgage that was taken out on this home.
Original Mortgage
$250,000
Interest Rate
3.82%
Mortgage Type
New Conventional
Create a Home Valuation Report for This Property
The Home Valuation Report is an in-depth analysis detailing your home's value as well as a comparison with similar homes in the area
Home Values in the Area
Average Home Value in this Area
Purchase History
| Date | Buyer | Sale Price | Title Company |
|---|---|---|---|
| Mig 2827 C St Llc | $1,282,000 | Wfg National Title | |
| 2827 C Street Llc | -- | None Available | |
| Davis William M | -- | Accommodation | |
| Davis William M | -- | First American Title Company |
Source: Public Records
Mortgage History
| Date | Status | Borrower | Loan Amount |
|---|---|---|---|
| Open | Mig 2827 C St Llc | $1,025,600 | |
| Previous Owner | Davis William M | $250,000 |
Source: Public Records
Tax History Compared to Growth
Tax History
| Year | Tax Paid | Tax Assessment Tax Assessment Total Assessment is a certain percentage of the fair market value that is determined by local assessors to be the total taxable value of land and additions on the property. | Land | Improvement |
|---|---|---|---|---|
| 2025 | $15,831 | $1,307,640 | $1,020,000 | $287,640 |
| 2024 | $15,831 | $1,282,000 | $1,000,000 | $282,000 |
| 2023 | $630 | $44,796 | $27,063 | $17,733 |
| 2022 | $614 | $43,919 | $26,533 | $17,386 |
| 2021 | $607 | $43,059 | $26,013 | $17,046 |
| 2020 | $599 | $42,619 | $25,747 | $16,872 |
| 2019 | $590 | $41,785 | $25,243 | $16,542 |
| 2018 | $555 | $40,967 | $24,749 | $16,218 |
| 2017 | $80 | $40,164 | $24,264 | $15,900 |
| 2016 | $531 | $39,378 | $23,789 | $15,589 |
| 2015 | $523 | $38,787 | $23,432 | $15,355 |
| 2014 | $516 | $38,028 | $22,973 | $15,055 |
Source: Public Records
Map
Nearby Homes
- 2875 B St
- 2891 B St
- 2917 C St Unit 187
- 2930 Broadway Unit 55
- 2911 C St Unit 95
- 2863 Broadway Unit 105
- 2752 B St Unit 112
- 2945 B St
- 2950 Broadway Unit 16
- 2715 A St
- 2650 Broadway Unit 101
- 2650 Broadway Unit 110
- 3029 Broadway Unit 4
- 1135-41 26th St
- 3078 Broadway Unit 216
- 1232-36 31st St
- 918-32 27th St
- 918-32 27th St Unit 918-32
- 1602 Granada Ave
- 1035 Edgemont Place
- 2835 C St
- 2835 C St Unit 4
- 2835 C St Unit 10
- 2835 C St Unit 9
- 2835 C St Unit 8
- 2835 C St Unit 7
- 2835 C St Unit 6
- 2835 C St Unit 5
- 2835 C St Unit 2
- 2835 C St Unit 1
- 2819 1/2 C St
- 2819 C St
- 2818 Broadway Unit 24
- 2843 C St Unit 6
- 2843 C St Unit 10
- 2843 C St
- 2828-2834 Broadway Unit 539-522-26, 25
- 2811 C St
- 1033 28th St
- 1025 28th St Unit 31