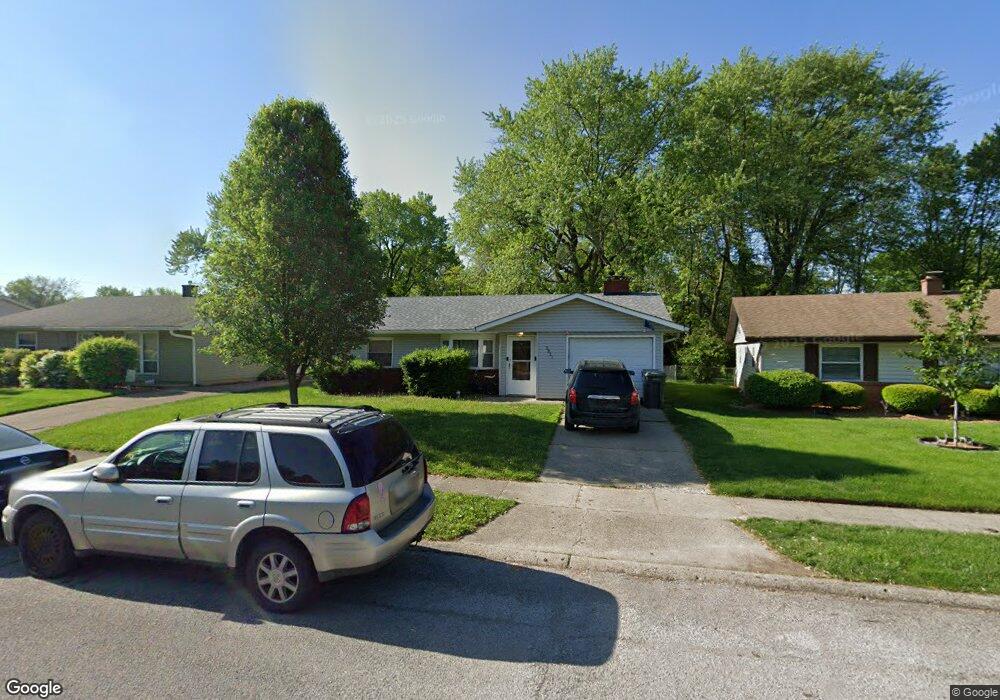
2827 Centre Pkwy Indianapolis, IN 46203
Near Southeast NeighborhoodEstimated Value: $143,000 - $195,000
3
Beds
1
Bath
1,136
Sq Ft
$149/Sq Ft
Est. Value
About This Home
This home is located at 2827 Centre Pkwy, Indianapolis, IN 46203 and is currently estimated at $169,058, approximately $148 per square foot. 2827 Centre Pkwy is a home located in Marion County with nearby schools including Eleanor Skillen School No. 34, Ralph Waldo Emerson School 58, and James A. Garfield School 31.
Ownership History
Date
Name
Owned For
Owner Type
Purchase Details
Closed on
May 30, 2025
Sold by
Replogle Mark E
Bought by
Bohlsen Bruce
Current Estimated Value
Home Financials for this Owner
Home Financials are based on the most recent Mortgage that was taken out on this home.
Original Mortgage
$139,428
Outstanding Balance
$139,070
Interest Rate
6.81%
Mortgage Type
FHA
Estimated Equity
$29,988
Purchase Details
Closed on
Dec 8, 2010
Sold by
The Huntington National Bank
Bought by
Replogle Mark E
Purchase Details
Closed on
Jun 30, 2010
Sold by
Smith Teri L
Bought by
The Huntington National Bank
Purchase Details
Closed on
Nov 10, 2006
Sold by
Taylor Eric M and Taylor Sandra K
Bought by
Smith Teri L
Home Financials for this Owner
Home Financials are based on the most recent Mortgage that was taken out on this home.
Original Mortgage
$94,900
Interest Rate
6.36%
Mortgage Type
New Conventional
Create a Home Valuation Report for This Property
The Home Valuation Report is an in-depth analysis detailing your home's value as well as a comparison with similar homes in the area
Home Values in the Area
Average Home Value in this Area
Purchase History
| Date | Buyer | Sale Price | Title Company |
|---|---|---|---|
| Bohlsen Bruce | $142,000 | None Listed On Document | |
| Replogle Mark E | -- | Hbi Title Services Inc | |
| The Huntington National Bank | $60,000 | None Available | |
| Smith Teri L | -- | None Available |
Source: Public Records
Mortgage History
| Date | Status | Borrower | Loan Amount |
|---|---|---|---|
| Open | Bohlsen Bruce | $139,428 | |
| Previous Owner | Smith Teri L | $94,900 |
Source: Public Records
Tax History Compared to Growth
Tax History
| Year | Tax Paid | Tax Assessment Tax Assessment Total Assessment is a certain percentage of the fair market value that is determined by local assessors to be the total taxable value of land and additions on the property. | Land | Improvement |
|---|---|---|---|---|
| 2024 | $3,245 | $138,700 | $14,700 | $124,000 |
| 2023 | $3,245 | $133,000 | $14,700 | $118,300 |
| 2022 | $3,176 | $130,800 | $14,700 | $116,100 |
| 2021 | $2,392 | $99,900 | $14,700 | $85,200 |
| 2020 | $2,244 | $93,200 | $14,700 | $78,500 |
| 2019 | $2,217 | $90,500 | $12,500 | $78,000 |
| 2018 | $1,963 | $79,100 | $12,500 | $66,600 |
| 2017 | $1,633 | $73,300 | $12,500 | $60,800 |
| 2016 | $1,459 | $66,600 | $12,500 | $54,100 |
| 2014 | $1,388 | $64,200 | $12,500 | $51,700 |
| 2013 | $1,335 | $64,200 | $12,500 | $51,700 |
Source: Public Records
Map
Nearby Homes
- 2824 Centre Pkwy
- 2825 S Oxford St
- 2832 S Oakland Ave
- 3022 Alice Ave
- 2854 Merts Dr
- 3062 S Temple Ave
- 3025 S Keystone Ave
- 2215 Albany St
- 2180 Cleveland St
- 2017 Ticen Ct
- 2060 Alton St
- 3319 S Tacoma Ave
- 2307 E Werges Ave
- 3015 E Sumner Ave
- 3226 Keystone Lakes Way
- 30 Gilbert Ave
- 2415 Finley Ave
- 1995 Britton Dr
- 2908 S Walcott St
- 2905 Dietz St
- 2829 Centre Pkwy
- 2821 Centre Pkwy
- 2905 Centre Pkwy
- 2815 Centre Pkwy
- 2922 S Parker Ave
- 2832 Centre Pkwy
- 2904 Centre Pkwy
- 2914 S Oxford St
- 2932 S Parker Ave
- 2910 Centre Pkwy
- 2863 S Oxford St
- 2908 S Oxford St
- 2942 S Parker Ave
- 2916 Centre Pkwy
- 2902 S Oxford St
- 2831 E Berwyn St
- 2911 S Parker Ave
- 2919 S Parker Ave
- 2903 E Berwyn St
- 2851 S Oxford St