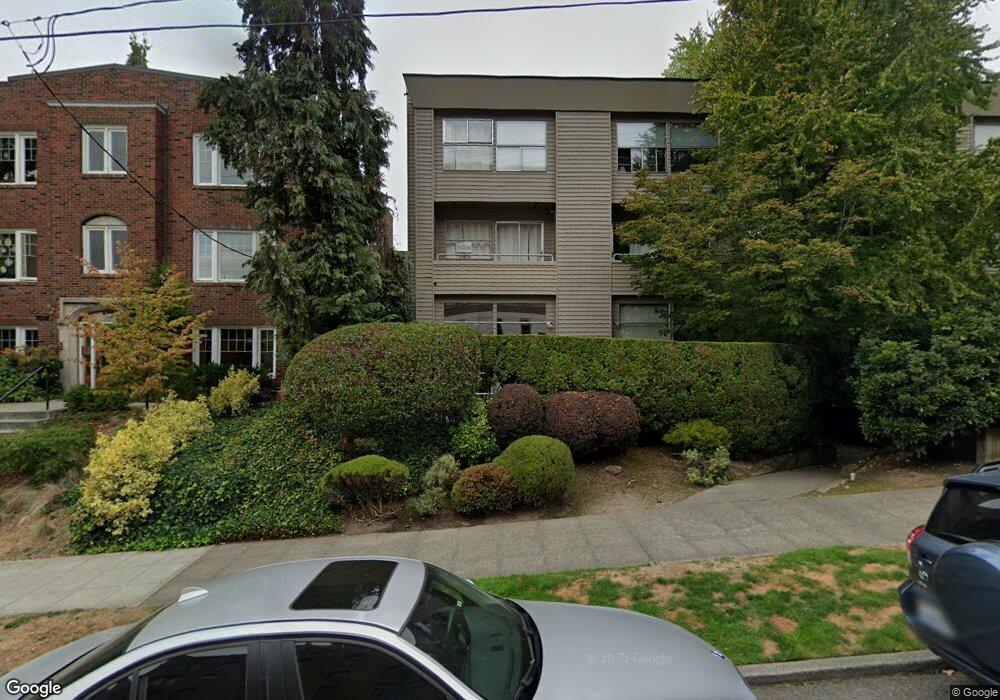
2827 Franklin Ave E Unit N9 Seattle, WA 98102
Eastlake NeighborhoodEstimated Value: $463,000 - $490,000
2
Beds
1
Bath
857
Sq Ft
$552/Sq Ft
Est. Value
About This Home
This home is located at 2827 Franklin Ave E Unit N9, Seattle, WA 98102 and is currently estimated at $473,045, approximately $551 per square foot. 2827 Franklin Ave E Unit N9 is a home located in King County with nearby schools including Montlake Elementary School, Meany Middle School, and Garfield High School.
Ownership History
Date
Name
Owned For
Owner Type
Purchase Details
Closed on
Oct 26, 2015
Sold by
Urner Elizabeth L
Bought by
Konesky Michael Joseph and Konesky Jacki Jo
Current Estimated Value
Home Financials for this Owner
Home Financials are based on the most recent Mortgage that was taken out on this home.
Original Mortgage
$175,000
Outstanding Balance
$133,888
Interest Rate
3.73%
Estimated Equity
$339,157
Purchase Details
Closed on
Jul 28, 1998
Sold by
Donlan Timothy F and Donlan Michael A
Bought by
Urner Elizabeth L
Home Financials for this Owner
Home Financials are based on the most recent Mortgage that was taken out on this home.
Original Mortgage
$133,000
Interest Rate
6.9%
Purchase Details
Closed on
Aug 2, 1994
Sold by
Wilson Cynthia L
Bought by
Donlan Timothy F and Donlan Michael A
Home Financials for this Owner
Home Financials are based on the most recent Mortgage that was taken out on this home.
Original Mortgage
$93,000
Interest Rate
8.06%
Create a Home Valuation Report for This Property
The Home Valuation Report is an in-depth analysis detailing your home's value as well as a comparison with similar homes in the area
Home Values in the Area
Average Home Value in this Area
Purchase History
We collect this data history from publicly available records. To have your information removed, we recommend requesting removal directly through your county’s website.
| Date | Buyer | Sale Price | Title Company |
|---|---|---|---|
| Konesky Michael Joseph | $350,000 | Cw Title Co | |
| Urner Elizabeth L | $173,500 | Chicago Title Insurance Co | |
| Donlan Timothy F | $143,000 | First American Title |
Source: Public Records
Mortgage History
We collect this data history from publicly available records. To have your information removed, we recommend requesting removal directly through your county’s website.
| Date | Status | Borrower | Loan Amount |
|---|---|---|---|
| Open | Konesky Michael Joseph | $175,000 | |
| Previous Owner | Urner Elizabeth L | $133,000 | |
| Previous Owner | Donlan Timothy F | $93,000 |
Source: Public Records
Tax History
| Year | Tax Paid | Tax Assessment Tax Assessment Total Assessment is a certain percentage of the fair market value that is determined by local assessors to be the total taxable value of land and additions on the property. | Land | Improvement |
|---|---|---|---|---|
| 2025 | $4,912 | $481,000 | $210,800 | $270,200 |
| 2024 | $4,652 | $491,000 | $223,200 | $267,800 |
| 2023 | $3,986 | $531,000 | $223,200 | $307,800 |
| 2022 | $3,990 | $476,000 | $198,400 | $277,600 |
| 2021 | $4,204 | $439,000 | $198,400 | $240,600 |
| 2020 | $4,725 | $440,000 | $214,900 | $225,100 |
| 2018 | $3,929 | $460,000 | $165,300 | $294,700 |
| 2017 | $3,307 | $402,000 | $115,700 | $286,300 |
| 2016 | $3,090 | $349,000 | $78,500 | $270,500 |
| 2015 | $3,240 | $318,000 | $78,500 | $239,500 |
| 2014 | -- | $342,000 | $78,500 | $263,500 |
| 2013 | -- | $276,000 | $78,500 | $197,500 |
Source: Public Records
Map
Nearby Homes
- 2829 Franklin Ave E Unit N2
- 2703 Boylston Ave E Unit 302
- 2830 Fairview Ave E
- 2834 Fairview Ave E
- 2915 Franklin Ave E Unit A
- 2921 Franklin Ave E Unit B
- 2633 Franklin Ave E Unit 102
- 2616 Franklin Ave E
- 2728 Fairview Ave E Unit 102
- 818 E Edgar St
- 2821 Fairview Ave E Unit 5
- 2960 Eastlake Ave E Unit 213
- 2960 Eastlake Ave E Unit 111
- 812 E Gwinn Place
- 2833 10th Ave E
- 2727 Fairview Ave E Unit 4
- 11 E Allison St Unit 2
- 3100 Fairview Ave E Unit 302
- 3122 Franklin Ave E Unit B
- 10 E Roanoke St Unit 8
- 2800 Franklin Ave E
- 2803 Boylston Ave E
- 2731 Boylston Ave E
- 2731 Boylston Ave E Unit 101
- 2731 Boylston Ave E Unit 202
- 2731 Boylston Ave E Unit 102
- 2731 Boylston Ave E Unit 301
- 2731 Boylston Ave E Unit 201
- 2731 Boylston Ave E Unit 300
- 2811 Franklin Ave E
- 2730 Franklin Ave E
- 2819 Franklin Ave E
- 2821 Franklin Ave E
- 2727 Boylston Ave E
- 2726 Franklin Ave E
- 2823 Franklin Ave E
- 220 E Hamlin St
- 2827 Franklin Ave E Unit S6
- 2827 Franklin Ave E Unit N1
- 2827 Franklin Ave E Unit S7
Your Personal Tour Guide
Ask me questions while you tour the home.