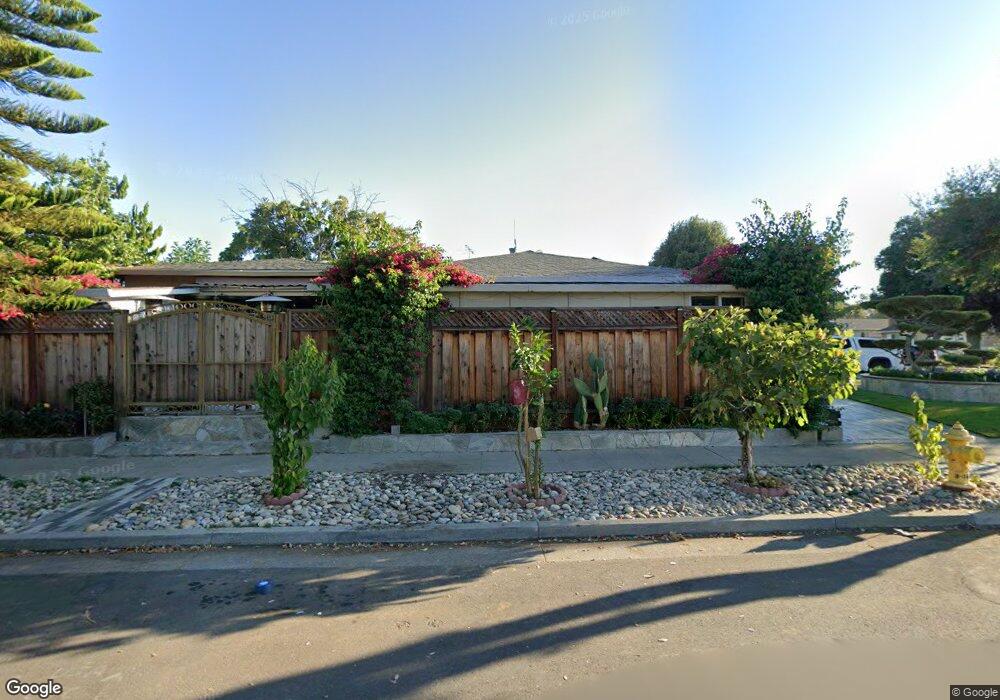
2827 Monte Cresta Way San Jose, CA 95132
Cherrywood NeighborhoodEstimated Value: $1,539,000 - $1,765,000
3
Beds
2
Baths
1,478
Sq Ft
$1,087/Sq Ft
Est. Value
About This Home
This home is located at 2827 Monte Cresta Way, San Jose, CA 95132 and is currently estimated at $1,606,084, approximately $1,086 per square foot. 2827 Monte Cresta Way is a home located in Santa Clara County with nearby schools including Cherrywood Elementary School, Sierramont Middle School, and Independence High School.
Ownership History
Date
Name
Owned For
Owner Type
Purchase Details
Closed on
Sep 2, 2025
Sold by
Vien Tuong Hoang Revocable Living Trust and Steven Hoang Vo Revocable Living Trust
Bought by
Steven Hoang Vo Revocable Living Trust and Vo
Current Estimated Value
Purchase Details
Closed on
Aug 15, 2022
Sold by
Vien Tuong Hoang Revocable Living Trust
Bought by
Vien Tuong Hoang Revocable Living Trust
Purchase Details
Closed on
Dec 30, 2020
Sold by
Hoang Vien Tuong and Vien Tuong Hoang
Bought by
Hoang Vien Tuong and Vo Steven Hoang
Home Financials for this Owner
Home Financials are based on the most recent Mortgage that was taken out on this home.
Original Mortgage
$608,000
Interest Rate
2.6%
Mortgage Type
New Conventional
Purchase Details
Closed on
Oct 30, 2020
Sold by
Hoang Vien Tuong and Vo Steven Hoang
Bought by
Hoang Vien Tuong and Vien Tuong Hoang
Purchase Details
Closed on
Jul 3, 2020
Sold by
Hoang Vien Tuong
Bought by
Hoang Vien Tuong and Vien Tuong Hoang
Purchase Details
Closed on
Feb 4, 2020
Sold by
Vo Kenneth and Hoang Vien Tuong
Bought by
Hoang Vien Tuong
Purchase Details
Closed on
Jul 30, 2016
Sold by
Vo Kenneth and Hoang Vien Tuong
Bought by
Vo Kenneth and Hoang Vien Tuong
Purchase Details
Closed on
Sep 11, 2001
Sold by
Vo Kenneth and Hoang Vien Tuong
Bought by
Vo Kenneth and Hoang Vien Tuong
Home Financials for this Owner
Home Financials are based on the most recent Mortgage that was taken out on this home.
Original Mortgage
$85,000
Interest Rate
7%
Mortgage Type
Credit Line Revolving
Purchase Details
Closed on
Aug 20, 2001
Sold by
Hoang Kha
Bought by
Vo Kenneth and Hoang Vien Tuong
Home Financials for this Owner
Home Financials are based on the most recent Mortgage that was taken out on this home.
Original Mortgage
$85,000
Interest Rate
7%
Mortgage Type
Credit Line Revolving
Purchase Details
Closed on
Apr 28, 1999
Sold by
Jianh Fang Chwen and Fen Hu I
Bought by
Vo Kenneth and Tuong Vien
Home Financials for this Owner
Home Financials are based on the most recent Mortgage that was taken out on this home.
Original Mortgage
$299,700
Interest Rate
6.98%
Purchase Details
Closed on
Apr 27, 1999
Sold by
Nguyen Sinh Thi
Bought by
Hoang Kha
Home Financials for this Owner
Home Financials are based on the most recent Mortgage that was taken out on this home.
Original Mortgage
$299,700
Interest Rate
6.98%
Create a Home Valuation Report for This Property
The Home Valuation Report is an in-depth analysis detailing your home's value as well as a comparison with similar homes in the area
Home Values in the Area
Average Home Value in this Area
Purchase History
| Date | Buyer | Sale Price | Title Company |
|---|---|---|---|
| Steven Hoang Vo Revocable Living Trust | -- | None Listed On Document | |
| Vien Tuong Hoang Revocable Living Trust | -- | -- | |
| Hoang Vien Tuong | $200,000 | Chicago Title Company | |
| Hoang Vien Tuong | -- | Chicago Title Company | |
| Hoang Vien Tuong | -- | None Available | |
| Hoang Vien Tuong | -- | None Available | |
| Vo Kenneth | -- | None Available | |
| Vo Kenneth | -- | First American Title Co | |
| Vo Kenneth | -- | First American Title Guarant | |
| Hoang Kha | -- | First American Title Guarant | |
| Vo Kenneth | $333,000 | Financial Title Company | |
| Hoang Kha | -- | Financial Title Company |
Source: Public Records
Mortgage History
| Date | Status | Borrower | Loan Amount |
|---|---|---|---|
| Previous Owner | Hoang Vien Tuong | $608,000 | |
| Previous Owner | Vo Kenneth | $85,000 | |
| Previous Owner | Vo Kenneth | $356,000 | |
| Previous Owner | Vo Kenneth | $299,700 |
Source: Public Records
Tax History Compared to Growth
Tax History
| Year | Tax Paid | Tax Assessment Tax Assessment Total Assessment is a certain percentage of the fair market value that is determined by local assessors to be the total taxable value of land and additions on the property. | Land | Improvement |
|---|---|---|---|---|
| 2025 | $8,562 | $521,627 | $208,649 | $312,978 |
| 2024 | $8,562 | $511,400 | $204,558 | $306,842 |
| 2023 | $8,379 | $501,374 | $200,548 | $300,826 |
| 2022 | $8,408 | $491,544 | $196,616 | $294,928 |
| 2021 | $8,010 | $481,907 | $192,761 | $289,146 |
| 2020 | $7,688 | $476,967 | $190,785 | $286,182 |
| 2019 | $7,371 | $467,616 | $187,045 | $280,571 |
| 2018 | $7,245 | $458,448 | $183,378 | $275,070 |
| 2017 | $7,262 | $449,460 | $179,783 | $269,677 |
| 2016 | $6,961 | $440,648 | $176,258 | $264,390 |
| 2015 | $6,881 | $434,030 | $173,611 | $260,419 |
| 2014 | $5,874 | $425,529 | $170,211 | $255,318 |
Source: Public Records
Map
Nearby Homes
- 2790 Longford Dr
- 1373 Ferrel Ct
- 2966 Crater Ln
- 1756 Valhalla Ct
- 1693 Peachwood Dr
- 2616 Sierra Village Ct
- 1199 Morrill Ave
- 2280 Zoria Cir
- 2210 Renfrew Ct
- 2520 Amaryl Dr
- 3093 Melchester Dr
- 2314 Oak Flat Rd
- 1599 Clampett Way
- 1898 Anne Marie Ct
- 1690 Coraltree Place
- 3190 Vesuvius Ln
- 3070 Ironside Ct
- 2844 Parkrow Ln
- 3092 Halgrim Ct
- 2064 Wizard Ct
- 2829 Monte Cresta Way
- 2811 Monte Cresta Way
- 2831 Monte Cresta Way
- 2809 Monte Cresta Way
- 2814 Monte Cresta Way
- 2812 Monte Cresta Way
- 2818 Monte Cresta Way
- 2826 Monte Cresta Way Unit 99
- 2828 Monte Cresta Way
- 1453 Lucena Ct
- 2833 Monte Cresta Way
- 2810 Monte Cresta Way
- 2830 Monte Cresta Way
- 2824 Monte Cresta Way
- 2807 Monte Cresta Way
- 2822 Monte Cresta Way
- 1457 Lucena Ct
- 2832 Monte Cresta Way
- 2808 Monte Cresta Way
- 2835 Monte Cresta Way