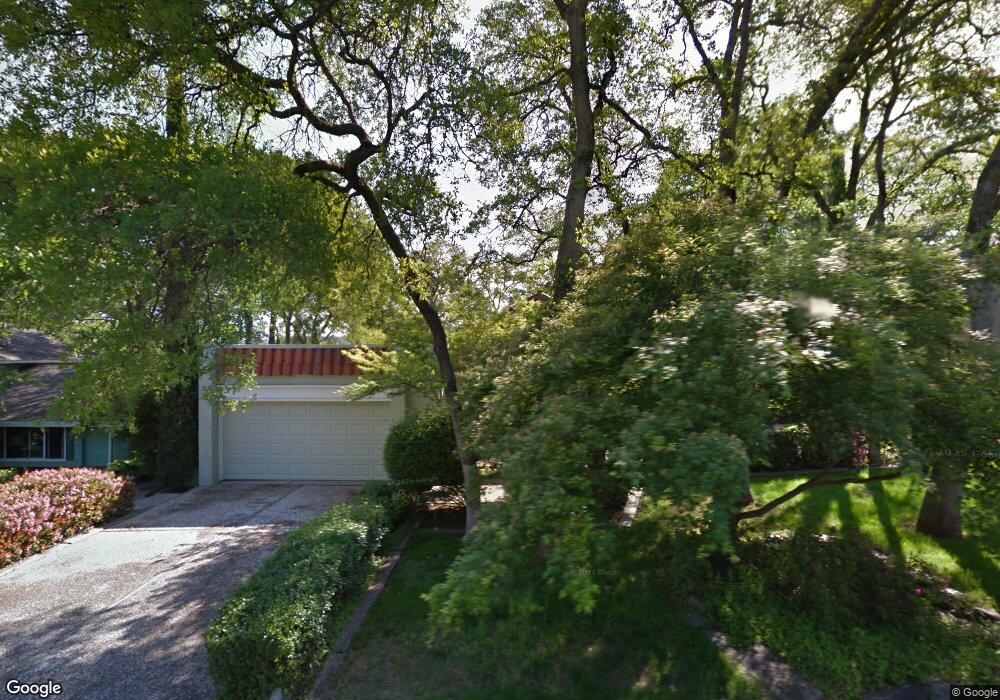
2827 Stephens Ln El Dorado Hills, CA 95762
Estimated Value: $755,000 - $824,000
4
Beds
3
Baths
2,017
Sq Ft
$388/Sq Ft
Est. Value
About This Home
This home is located at 2827 Stephens Ln, El Dorado Hills, CA 95762 and is currently estimated at $783,208, approximately $388 per square foot. 2827 Stephens Ln is a home located in El Dorado County with nearby schools including Silva Valley Elementary School, Rolling Hills Middle School, and Oak Ridge High School.
Ownership History
Date
Name
Owned For
Owner Type
Purchase Details
Closed on
Jun 14, 2024
Sold by
Schulhoff David J and Schulhoff Lona M
Bought by
Martello Sam David and Schroll Arnold
Current Estimated Value
Home Financials for this Owner
Home Financials are based on the most recent Mortgage that was taken out on this home.
Original Mortgage
$490,000
Outstanding Balance
$483,830
Interest Rate
7.09%
Mortgage Type
New Conventional
Estimated Equity
$299,378
Purchase Details
Closed on
Jul 21, 2000
Sold by
Sanders Edward M and Sanders Vickie L
Bought by
Schulhoff David J and Schulhoff Lona M
Home Financials for this Owner
Home Financials are based on the most recent Mortgage that was taken out on this home.
Original Mortgage
$196,000
Interest Rate
8.2%
Create a Home Valuation Report for This Property
The Home Valuation Report is an in-depth analysis detailing your home's value as well as a comparison with similar homes in the area
Home Values in the Area
Average Home Value in this Area
Purchase History
| Date | Buyer | Sale Price | Title Company |
|---|---|---|---|
| Martello Sam David | $790,000 | Fidelity National Title | |
| Schulhoff David J | $246,000 | Placer Title Company |
Source: Public Records
Mortgage History
| Date | Status | Borrower | Loan Amount |
|---|---|---|---|
| Open | Martello Sam David | $490,000 | |
| Previous Owner | Schulhoff David J | $196,000 |
Source: Public Records
Tax History Compared to Growth
Tax History
| Year | Tax Paid | Tax Assessment Tax Assessment Total Assessment is a certain percentage of the fair market value that is determined by local assessors to be the total taxable value of land and additions on the property. | Land | Improvement |
|---|---|---|---|---|
| 2025 | $3,840 | $805,800 | $201,960 | $603,840 |
| 2024 | $3,840 | $363,385 | $110,782 | $252,603 |
| 2023 | $3,738 | $356,260 | $108,610 | $247,650 |
| 2022 | $3,711 | $349,276 | $106,481 | $242,795 |
| 2021 | $3,659 | $342,429 | $104,394 | $238,035 |
| 2020 | $3,611 | $338,919 | $103,324 | $235,595 |
| 2019 | $3,554 | $332,275 | $101,299 | $230,976 |
| 2018 | $3,428 | $325,761 | $99,313 | $226,448 |
| 2017 | $3,366 | $319,374 | $97,366 | $222,008 |
| 2016 | $3,322 | $313,112 | $95,457 | $217,655 |
| 2015 | $3,235 | $308,411 | $94,024 | $214,387 |
| 2014 | $3,235 | $302,372 | $92,183 | $210,189 |
Source: Public Records
Map
Nearby Homes
- 2846 Stephens Ln
- 921 Stoneman Way
- 4251 Hensley Cir
- 3197 Warren Ln
- 6041 Toscana Loop
- 2703 King Richard Dr
- 5200 Piazza Place
- 5192 Piazza Place
- 952 King Henry Way
- 949 King Henry Way
- 1999 Shelby Cir
- 2668 Tam o Shanter Dr
- 954 King Richard Ct
- 2757 Capetanios Dr
- 1780 Darwin Way
- 1041 Elmwood Ct
- 2628 Tam o Shanter Dr
- 4267 Suffolk Way
- 0 Capetanios Dr Unit 222109547
- 3058 Ridgeview Dr
- 2821 Stephens Ln
- 2833 Stephens Ln
- 908 Stoneman Way
- 900 Stoneman Way
- 2815 Stephens Ln
- 2841 Stephens Ln
- 914 Stoneman Way
- 894 Stoneman Way
- 2826 Stephens Ln
- 2820 Stephens Ln
- 2832 Stephens Ln
- 884 Stoneman Way
- 2814 Stephens Ln
- 2807 Stephens Ln
- 920 Stoneman Way
- 2840 Stephens Ln
- 2847 Stephens Ln
- 3042 Richardson Cir
- 930 Stoneman Way
- 848 Stoneman Way