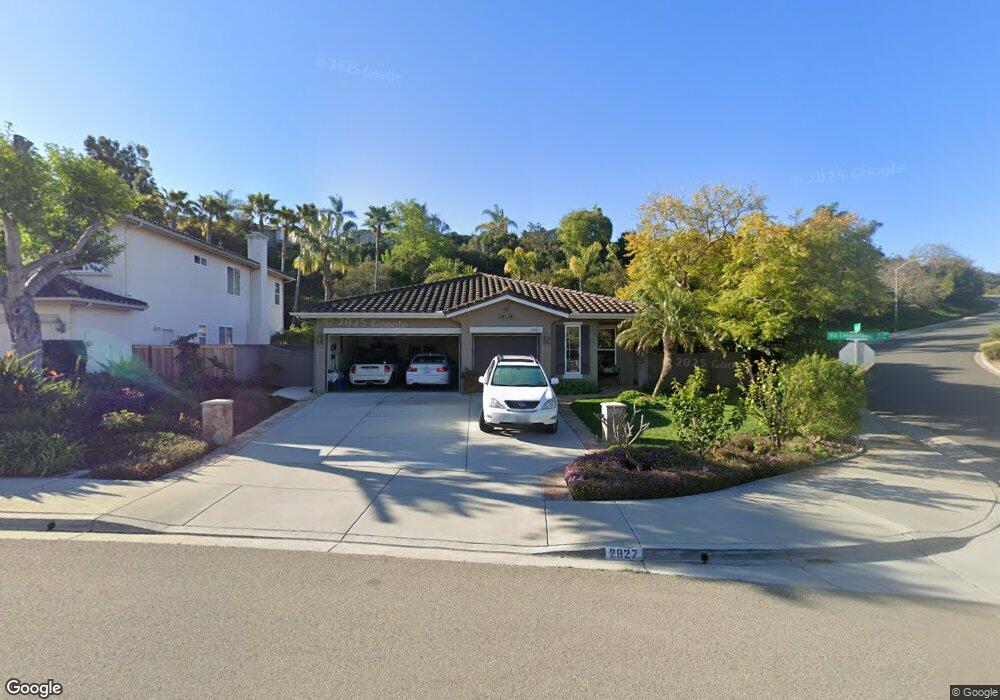
2827 Via Conquistador Carlsbad, CA 92009
Rancho Carrillo NeighborhoodEstimated Value: $1,580,000 - $1,738,668
3
Beds
3
Baths
2,203
Sq Ft
$753/Sq Ft
Est. Value
About This Home
This home is located at 2827 Via Conquistador, Carlsbad, CA 92009 and is currently estimated at $1,658,917, approximately $753 per square foot. 2827 Via Conquistador is a home located in San Diego County with nearby schools including Carrillo Elementary, San Elijo Middle School, and San Marcos High School.
Ownership History
Date
Name
Owned For
Owner Type
Purchase Details
Closed on
Oct 28, 2002
Sold by
Stephens Jack E and Stephens Ashley N
Bought by
Stephens Jack E and Stephens Ashley N
Current Estimated Value
Home Financials for this Owner
Home Financials are based on the most recent Mortgage that was taken out on this home.
Original Mortgage
$297,350
Interest Rate
5.26%
Purchase Details
Closed on
Feb 22, 2001
Sold by
Stephens Jack and Stephens Ashley
Bought by
Stephens Jack E and Stephens Ashley N
Purchase Details
Closed on
Feb 15, 2000
Sold by
Shea Homes Ltd Partnership
Bought by
Stephens Jack and Stephens Ashley
Home Financials for this Owner
Home Financials are based on the most recent Mortgage that was taken out on this home.
Original Mortgage
$252,700
Interest Rate
7.5%
Create a Home Valuation Report for This Property
The Home Valuation Report is an in-depth analysis detailing your home's value as well as a comparison with similar homes in the area
Home Values in the Area
Average Home Value in this Area
Purchase History
| Date | Buyer | Sale Price | Title Company |
|---|---|---|---|
| Stephens Jack E | -- | First American Title | |
| Stephens Jack E | -- | First American Title | |
| Stephens Jack E | -- | -- | |
| Stephens Jack | $337,000 | First American Title |
Source: Public Records
Mortgage History
| Date | Status | Borrower | Loan Amount |
|---|---|---|---|
| Closed | Stephens Jack E | $297,350 | |
| Closed | Stephens Jack | $252,700 | |
| Closed | Stephens Jack | $50,400 |
Source: Public Records
Tax History Compared to Growth
Tax History
| Year | Tax Paid | Tax Assessment Tax Assessment Total Assessment is a certain percentage of the fair market value that is determined by local assessors to be the total taxable value of land and additions on the property. | Land | Improvement |
|---|---|---|---|---|
| 2025 | $7,705 | $570,344 | $245,906 | $324,438 |
| 2024 | $7,705 | $559,162 | $241,085 | $318,077 |
| 2023 | $7,813 | $548,199 | $236,358 | $311,841 |
| 2022 | $8,400 | $537,451 | $231,724 | $305,727 |
| 2021 | $8,302 | $526,914 | $227,181 | $299,733 |
| 2020 | $8,245 | $521,512 | $224,852 | $296,660 |
| 2019 | $8,180 | $511,288 | $220,444 | $290,844 |
| 2018 | $7,996 | $501,264 | $216,122 | $285,142 |
| 2017 | $90 | $491,436 | $211,885 | $279,551 |
| 2016 | $7,801 | $481,801 | $207,731 | $274,070 |
| 2015 | $7,724 | $474,565 | $204,611 | $269,954 |
| 2014 | $7,602 | $465,269 | $200,603 | $264,666 |
Source: Public Records
Map
Nearby Homes
- 2930 Rancho Cortes
- 3223 Rancho Quartillo
- 6267 Via Trato
- 6412 Terraza Portico
- 6417 Terraza Portico
- 6289 Citracado Cir
- 6154 Citracado Cir Unit 36
- 6180 Citracado Cir Unit 48
- 3137 Avenida Topanga
- 6502 La Paloma St
- 6008 Paseo Salinero
- 2915 Rancho Posta
- 6691 Corte Eduardo
- 6712 Cantil St
- 6541 Vispera Place
- 2568 Abedul St
- 6844 Urubu St
- 2196 Coast Ave
- 6759 Paseo Del Vista
- 2153 Goya Place
- 2831 Via Conquistador
- 2823 Via Conquistador
- 2835 Via Conquistador
- 2819 Via Conquistador Unit Studio
- 2819 Via Conquistador
- 2832 Via Conquistador
- 2836 Via Conquistador
- 2839 Via Conquistador
- 2814 Rancho Pancho
- 2810 Rancho Pancho
- 2818 Rancho Pancho
- 2815 Via Conquistador
- 2840 Via Conquistador
- 2843 Via Conquistador
- 2830 Rancho Pancho
- 2834 Rancho Pancho
- 2806 Rancho Pancho
- 2826 Rancho Pancho
- 2838 Rancho Pancho
- 2844 Via Conquistador