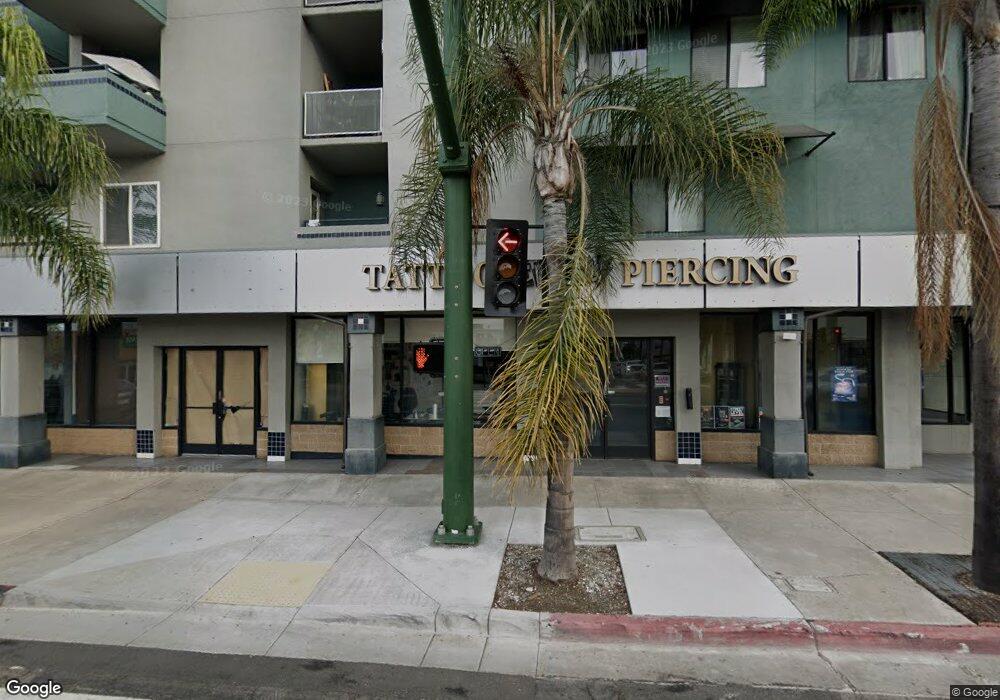
2828 2828 University Avenue #103 San Diego, CA 92104
North Park NeighborhoodEstimated Value: $341,427
--
Bed
--
Bath
600
Sq Ft
$569/Sq Ft
Est. Value
About This Home
This home is located at 2828 2828 University Avenue #103, San Diego, CA 92104 and is currently estimated at $341,427, approximately $569 per square foot. 2828 2828 University Avenue #103 is a home located in San Diego County with nearby schools including Jefferson Elementary and Roosevelt International Middle School.
Ownership History
Date
Name
Owned For
Owner Type
Purchase Details
Closed on
Feb 13, 2025
Sold by
Nguyen Hien T
Bought by
Timshel Llc
Current Estimated Value
Purchase Details
Closed on
Jul 28, 2016
Sold by
Mounthill 1031 Llc
Bought by
Nguyen Hien T
Purchase Details
Closed on
Apr 30, 2016
Sold by
Waterloo Properties Llc
Bought by
Mounthill 1031 Llc
Home Financials for this Owner
Home Financials are based on the most recent Mortgage that was taken out on this home.
Original Mortgage
$205,000
Interest Rate
3.71%
Mortgage Type
Commercial
Purchase Details
Closed on
Sep 19, 2007
Sold by
D&A Semi Annual Mortgage Fund Iii Lp
Bought by
Waterloo Properties Llc
Home Financials for this Owner
Home Financials are based on the most recent Mortgage that was taken out on this home.
Original Mortgage
$112,500
Interest Rate
6.61%
Mortgage Type
Commercial
Create a Home Valuation Report for This Property
The Home Valuation Report is an in-depth analysis detailing your home's value as well as a comparison with similar homes in the area
Home Values in the Area
Average Home Value in this Area
Purchase History
| Date | Buyer | Sale Price | Title Company |
|---|---|---|---|
| Timshel Llc | $330,000 | Chicago Title | |
| Nguyen Hien T | $205,000 | Fidelity National Title Co | |
| Mounthill 1031 Llc | $225,000 | Fidelity Natl Title Co Sd | |
| Waterloo Properties Llc | $150,000 | First American Title Co |
Source: Public Records
Mortgage History
| Date | Status | Borrower | Loan Amount |
|---|---|---|---|
| Previous Owner | Mounthill 1031 Llc | $205,000 | |
| Previous Owner | Waterloo Properties Llc | $112,500 |
Source: Public Records
Tax History Compared to Growth
Tax History
| Year | Tax Paid | Tax Assessment Tax Assessment Total Assessment is a certain percentage of the fair market value that is determined by local assessors to be the total taxable value of land and additions on the property. | Land | Improvement |
|---|---|---|---|---|
| 2025 | $3,392 | $261,125 | $92,843 | $168,282 |
| 2024 | $3,392 | $256,006 | $91,023 | $164,983 |
| 2023 | $3,311 | $250,988 | $89,239 | $161,749 |
| 2022 | $3,217 | $246,068 | $87,490 | $158,578 |
| 2021 | $3,167 | $241,244 | $85,775 | $155,469 |
| 2020 | $3,129 | $238,771 | $84,896 | $153,875 |
| 2019 | $3,076 | $234,090 | $83,232 | $150,858 |
| 2018 | $2,885 | $229,500 | $81,600 | $147,900 |
| 2017 | $83 | $225,000 | $80,000 | $145,000 |
| 2016 | $2,300 | $188,620 | $66,570 | $122,050 |
| 2015 | $2,266 | $185,788 | $65,571 | $120,217 |
| 2014 | $2,232 | $182,150 | $64,287 | $117,863 |
Source: Public Records
Map
Nearby Homes
- 2828 University Ave Unit 503
- 3946 Utah St Unit 3
- 3970 Utah St Unit 9
- 4043 Utah St Unit 8
- 3933-45 Hamilton St
- 3957 30th St Unit 319
- 4010-16 Oregon St
- 4075 Idaho St Unit 2
- 3776 Villa Terrace
- 3764 Villa Terrace
- 3950 Ohio St Unit 507
- 3950 Ohio St Unit 226
- 4074 30th St
- 4018-24 Hamilton St
- 4030 Ohio St
- 3660 28th St
- 3762 Arnold Ave Unit 1
- 3644 29th St
- 3928 Arizona St Unit 3
- 4119-23 Kansas
- 2828 2828 Univesity Ave Ste 103
- 2828 University Ave
- 2828 University Ave Unit 106
- 2828 University Ave
- 2828 University Ave Unit 103
- 2828 University Ave Unit 202
- 2828 University Ave Unit 506
- 2828 University Ave Unit 505
- 2828 University Ave Unit 504
- 2828 University Ave Unit 502
- 2828 University Ave Unit 501
- 2828 University Ave Unit 410
- 2828 University Ave Unit 409
- 2828 University Ave Unit 408
- 2828 University Ave Unit 407
- 2828 University Ave Unit 206
- 2828 University Ave Unit 205
- 2828 University Ave Unit 204
- 2828 University Ave Unit 203
- 2828 University Ave Unit 201