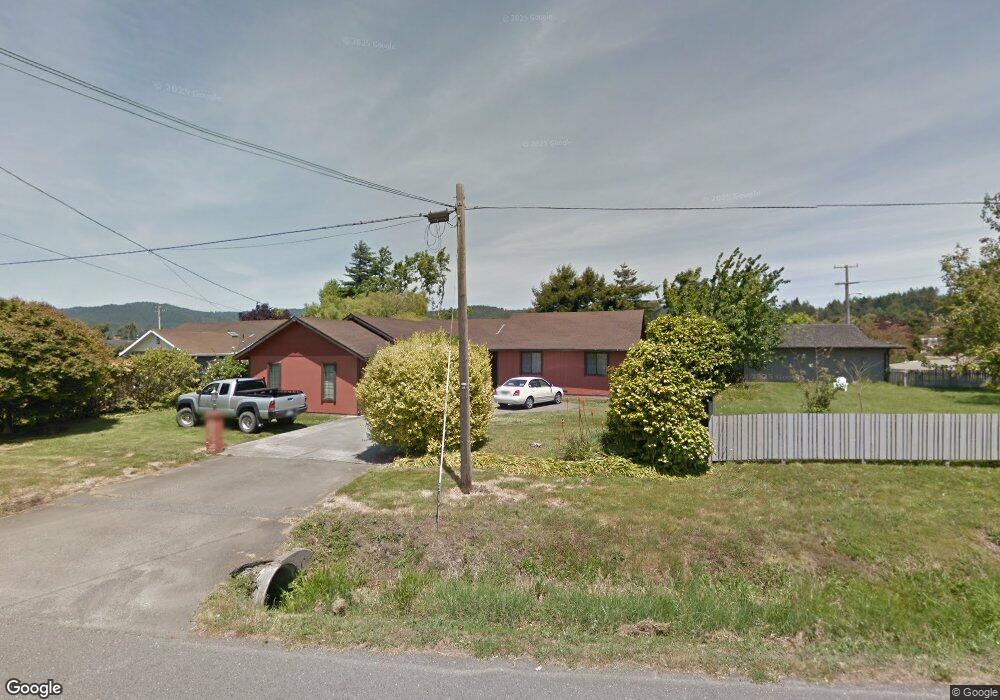
2828 Kenmar Rd Fortuna, CA 95540
Estimated Value: $363,429 - $465,000
3
Beds
2
Baths
1,300
Sq Ft
$314/Sq Ft
Est. Value
About This Home
This home is located at 2828 Kenmar Rd, Fortuna, CA 95540 and is currently estimated at $408,357, approximately $314 per square foot. 2828 Kenmar Rd is a home located in Humboldt County with nearby schools including Fortuna Union High School, East High School, and Redwood Preparatory Charter School.
Ownership History
Date
Name
Owned For
Owner Type
Purchase Details
Closed on
Apr 12, 2012
Sold by
Filippini David J
Bought by
Filippini David J
Current Estimated Value
Purchase Details
Closed on
Jun 13, 2000
Sold by
Filippini Lisa D
Bought by
Filippini David J
Home Financials for this Owner
Home Financials are based on the most recent Mortgage that was taken out on this home.
Original Mortgage
$128,725
Interest Rate
8.63%
Mortgage Type
Purchase Money Mortgage
Purchase Details
Closed on
Jul 3, 1997
Sold by
Mckerney Charles B and Murphy Mckerney M
Bought by
Mueller Barry W and Mueller Julie A
Home Financials for this Owner
Home Financials are based on the most recent Mortgage that was taken out on this home.
Original Mortgage
$121,421
Interest Rate
7.42%
Mortgage Type
FHA
Create a Home Valuation Report for This Property
The Home Valuation Report is an in-depth analysis detailing your home's value as well as a comparison with similar homes in the area
Home Values in the Area
Average Home Value in this Area
Purchase History
| Date | Buyer | Sale Price | Title Company |
|---|---|---|---|
| Filippini David J | -- | None Available | |
| Filippini David J | -- | First American Title Ins Co | |
| Filippini David J | $135,500 | First American Title Ins Co | |
| Mueller Barry W | $125,000 | First American Title Ins Co |
Source: Public Records
Mortgage History
| Date | Status | Borrower | Loan Amount |
|---|---|---|---|
| Previous Owner | Filippini David J | $128,725 | |
| Previous Owner | Mueller Barry W | $121,421 |
Source: Public Records
Tax History Compared to Growth
Tax History
| Year | Tax Paid | Tax Assessment Tax Assessment Total Assessment is a certain percentage of the fair market value that is determined by local assessors to be the total taxable value of land and additions on the property. | Land | Improvement |
|---|---|---|---|---|
| 2025 | $2,184 | $204,151 | $67,796 | $136,355 |
| 2024 | $2,184 | $200,149 | $66,467 | $133,682 |
| 2023 | $2,142 | $196,225 | $65,164 | $131,061 |
| 2022 | $2,136 | $192,379 | $63,887 | $128,492 |
| 2021 | $2,105 | $188,608 | $62,635 | $125,973 |
| 2020 | $2,103 | $186,675 | $61,993 | $124,682 |
| 2019 | $2,065 | $183,016 | $60,778 | $122,238 |
| 2018 | $2,039 | $179,429 | $59,587 | $119,842 |
| 2017 | $1,944 | $175,912 | $58,419 | $117,493 |
| 2016 | $1,897 | $172,464 | $57,274 | $115,190 |
| 2015 | $1,811 | $169,874 | $56,414 | $113,460 |
| 2014 | $1,764 | $166,547 | $55,309 | $111,238 |
Source: Public Records
Map
Nearby Homes
- 1545 Xavier Ct
- 1274 Ross Hill Rd
- 3251 Matthew Ln
- 3310 School St
- 2550 W School St
- 1545 Kings Row
- 2208 Royal Dr
- 184 Empire Dr
- 197 Empire Dr
- 1521 Imperial Way
- 185 Empire Dr
- 136 Castle Ct
- 160 Monarch Dr
- 1514 Crest Dr
- 1598 Queens Row
- 1604 Imperial Way
- 2755 Highland Dr
- 2725 Murray Ct
- 4372 Forest Hills Dr
- 4391 Woodcock Ct
- 2867 Shields Ln
- 2816 Kenmar Rd
- 2808 Kenmar Rd
- 2704 Shields Ln
- 2871 Shields Ln
- 2823 Kenmar Rd
- 2900 Kenwood Dr
- 2815 Kenmar Rd
- 2831 Kenmar Rd
- 2882 Kenwood Dr
- 2776 Shields Ln
- 2789 Kenmar Rd
- 2849 Kenmar Rd
- 2912 Kenwood Dr
- 2875 Shields Ln
- 1831 Kelli Way
- 2798 Shields Ln
- 2775 Kenmar Rd
- 1853 Kelli Way
- 1805 Kelli Way