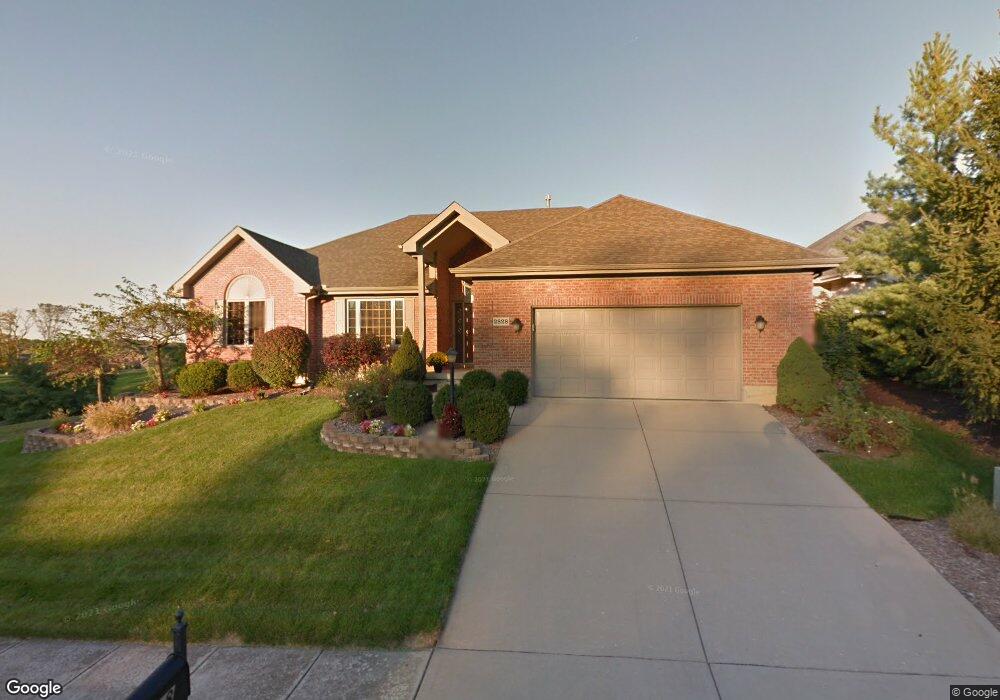
2828 Legend Falls Ct Beavercreek, OH 45431
Estimated Value: $451,706 - $471,000
3
Beds
2
Baths
2,130
Sq Ft
$217/Sq Ft
Est. Value
About This Home
This home is located at 2828 Legend Falls Ct, Beavercreek, OH 45431 and is currently estimated at $461,677, approximately $216 per square foot. 2828 Legend Falls Ct is a home located in Greene County with nearby schools including Shaw Elementary School, Jacob Coy Middle School, and Beavercreek High School.
Ownership History
Date
Name
Owned For
Owner Type
Purchase Details
Closed on
Jan 16, 2025
Sold by
Cw-Amberwood Llc
Bought by
Fischer Single Family Homes Iv Llc
Current Estimated Value
Purchase Details
Closed on
Oct 23, 2020
Sold by
Flick Peter M
Bought by
Hensley Joanna
Home Financials for this Owner
Home Financials are based on the most recent Mortgage that was taken out on this home.
Original Mortgage
$329,500
Interest Rate
2.9%
Mortgage Type
VA
Purchase Details
Closed on
Feb 5, 1999
Sold by
Sharp & Martz Inc
Bought by
Flick Peter M and Hart Tracy L
Home Financials for this Owner
Home Financials are based on the most recent Mortgage that was taken out on this home.
Original Mortgage
$193,624
Interest Rate
6.88%
Purchase Details
Closed on
Jul 10, 1998
Sold by
Bcgolf Ltd Partnership
Bought by
Sharp & Martz Inc
Home Financials for this Owner
Home Financials are based on the most recent Mortgage that was taken out on this home.
Original Mortgage
$173,600
Interest Rate
7.17%
Create a Home Valuation Report for This Property
The Home Valuation Report is an in-depth analysis detailing your home's value as well as a comparison with similar homes in the area
Home Values in the Area
Average Home Value in this Area
Purchase History
| Date | Buyer | Sale Price | Title Company |
|---|---|---|---|
| Fischer Single Family Homes Iv Llc | $262,336 | None Listed On Document | |
| Hensley Joanna | $329,500 | None Available | |
| Flick Peter M | $242,100 | -- | |
| Sharp & Martz Inc | $49,300 | -- |
Source: Public Records
Mortgage History
| Date | Status | Borrower | Loan Amount |
|---|---|---|---|
| Previous Owner | Hensley Joanna | $329,500 | |
| Previous Owner | Flick Peter M | $193,624 | |
| Previous Owner | Sharp & Martz Inc | $173,600 |
Source: Public Records
Tax History Compared to Growth
Tax History
| Year | Tax Paid | Tax Assessment Tax Assessment Total Assessment is a certain percentage of the fair market value that is determined by local assessors to be the total taxable value of land and additions on the property. | Land | Improvement |
|---|---|---|---|---|
| 2024 | $7,112 | $127,690 | $21,280 | $106,410 |
| 2023 | $7,112 | $127,690 | $21,280 | $106,410 |
| 2022 | $6,728 | $107,730 | $21,280 | $86,450 |
| 2021 | $6,590 | $106,440 | $21,280 | $85,160 |
| 2020 | $7,823 | $106,440 | $21,280 | $85,160 |
| 2019 | $6,997 | $86,830 | $18,520 | $68,310 |
| 2018 | $6,181 | $86,830 | $18,520 | $68,310 |
| 2017 | $6,593 | $86,830 | $18,520 | $68,310 |
| 2016 | $6,594 | $89,880 | $18,520 | $71,360 |
| 2015 | $6,555 | $89,880 | $18,520 | $71,360 |
| 2014 | $6,457 | $89,880 | $18,520 | $71,360 |
Source: Public Records
Map
Nearby Homes
- 2415 New Germany Trebein Rd
- 2669 Golden Leaf Dr Unit 16-305
- 2715 Golden Leaf Dr
- 2735 Golden Leaf Dr
- 2741 Golden Leaf Dr
- 2707 Golden Leaf Dr
- 2727 Golden Leaf Dr
- 2649 Golden Leaf Dr Unit 16-300
- 2715 Golden Leaf Dr Unit 19-204
- 2727 Golden Leaf Dr Unit 18-300
- 2735 Golden Leaf Dr Unit 18-202
- 2741 Golden Leaf Dr Unit 18-203
- 2707 Golden Leaf Dr Unit 19-305
- 2749 Golden Leaf Dr Unit 18-305
- 2821 Varsity Dr
- 2775 Double Eagle Dr
- 2873 Cove Cir
- 2490 Bent Grass Dr
- 2481 Bent Grass Dr
- 2510 Bent Grass Dr
- 2824 Legend Falls Ct
- Lot 15 Legend Falls Ct
- 2847 Devonshire Ct
- 2842 Legend Falls Ct
- 2855 Devonshire Ct
- 2839 Devonshire Ct
- 2819 Legend Falls Ct
- 2834 Legend Falls Ct
- 2831 Helen Gorby Way
- 2746 Chatham Ct
- 2861 Devonshire Ct
- 2848 Legend Falls Ct
- 2755 Chatham Ct
- 2752 Chatham Ct
- Lot 23 Devonshire Ct
- Lot 25 Devonshire Ct
- Lot 24 Devonshire Ct
- 2869 Devonshire Ct
- 2851 Legend Falls Ct
- 2850 Devonshire Ct