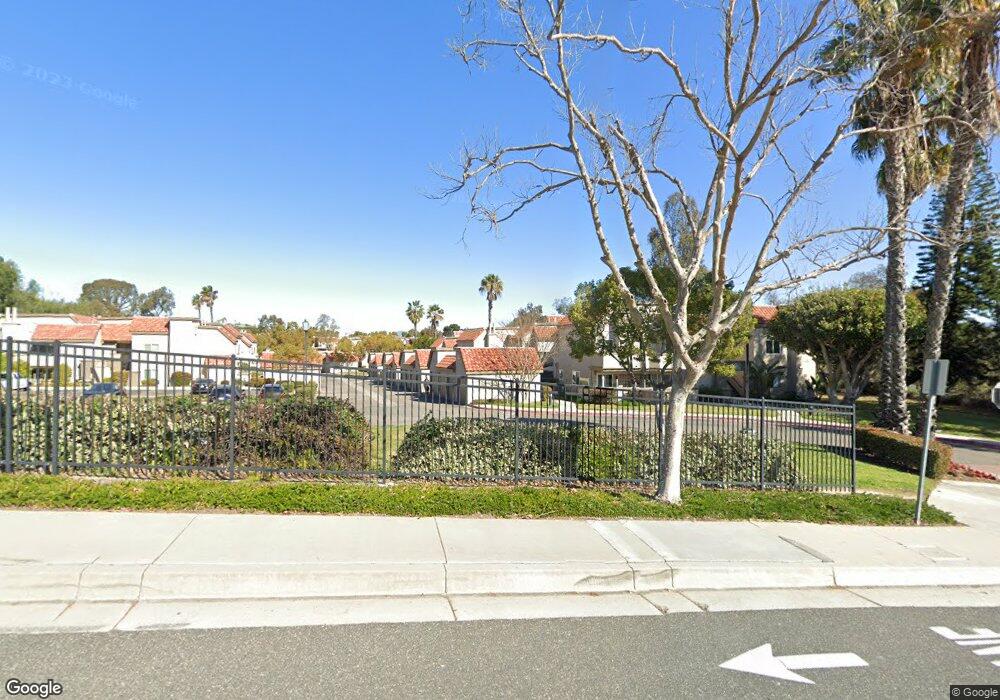
28282 Sorrento Unit 149 Laguna Niguel, CA 92677
Colinas de Capistrano NeighborhoodEstimated Value: $570,573 - $622,000
2
Beds
2
Baths
826
Sq Ft
$727/Sq Ft
Est. Value
About This Home
This home is located at 28282 Sorrento Unit 149, Laguna Niguel, CA 92677 and is currently estimated at $600,893, approximately $727 per square foot. 28282 Sorrento Unit 149 is a home located in Orange County with nearby schools including Hidden Hills Elementary, Niguel Hills Middle School, and Dana Hills High School.
Ownership History
Date
Name
Owned For
Owner Type
Purchase Details
Closed on
Nov 12, 2005
Sold by
Byard April L
Bought by
April Lee Byard Living Trust and Byard April Lee
Current Estimated Value
Purchase Details
Closed on
Apr 30, 2000
Sold by
Byard Robert E and Byard April L
Bought by
Byard April L
Purchase Details
Closed on
Aug 25, 1999
Sold by
Mcconnell Karen
Bought by
Mcconnell James A
Home Financials for this Owner
Home Financials are based on the most recent Mortgage that was taken out on this home.
Original Mortgage
$139,740
Outstanding Balance
$39,874
Interest Rate
7.56%
Mortgage Type
VA
Estimated Equity
$561,019
Purchase Details
Closed on
Aug 3, 1999
Sold by
Mcconnell James A and Mcconnell Eugene C
Bought by
Byard Robert E and Byard April L
Home Financials for this Owner
Home Financials are based on the most recent Mortgage that was taken out on this home.
Original Mortgage
$139,740
Outstanding Balance
$39,874
Interest Rate
7.56%
Mortgage Type
VA
Estimated Equity
$561,019
Create a Home Valuation Report for This Property
The Home Valuation Report is an in-depth analysis detailing your home's value as well as a comparison with similar homes in the area
Home Values in the Area
Average Home Value in this Area
Purchase History
| Date | Buyer | Sale Price | Title Company |
|---|---|---|---|
| April Lee Byard Living Trust | -- | -- | |
| Byard April L | -- | -- | |
| Mcconnell James A | -- | Chicago Title Co | |
| Byard Robert E | $136,000 | Chicago Title Co |
Source: Public Records
Mortgage History
| Date | Status | Borrower | Loan Amount |
|---|---|---|---|
| Open | Byard Robert E | $139,740 |
Source: Public Records
Tax History Compared to Growth
Tax History
| Year | Tax Paid | Tax Assessment Tax Assessment Total Assessment is a certain percentage of the fair market value that is determined by local assessors to be the total taxable value of land and additions on the property. | Land | Improvement |
|---|---|---|---|---|
| 2025 | $2,089 | $209,020 | $106,317 | $102,703 |
| 2024 | $2,089 | $204,922 | $104,232 | $100,690 |
| 2023 | $2,045 | $200,904 | $102,188 | $98,716 |
| 2022 | $2,006 | $196,965 | $100,184 | $96,781 |
| 2021 | $1,967 | $193,103 | $98,219 | $94,884 |
| 2020 | $1,948 | $191,123 | $97,211 | $93,912 |
| 2019 | $1,910 | $187,376 | $95,305 | $92,071 |
| 2018 | $1,873 | $183,702 | $93,436 | $90,266 |
| 2017 | $1,836 | $180,100 | $91,603 | $88,497 |
| 2016 | $1,802 | $176,569 | $89,807 | $86,762 |
| 2015 | $1,774 | $173,917 | $88,458 | $85,459 |
| 2014 | $1,740 | $170,511 | $86,726 | $83,785 |
Source: Public Records
Map
Nearby Homes
- 28201 Sorrento Unit 115
- 28215 Paseo el Siena Unit 46
- 25961 Montemar Unit 67
- 28151 Montecito Unit 36
- 28422 La Pradera
- 28305 Paseo el Siena Unit 10
- 28121 Montecito Unit 21
- 28435 La Pradera
- 28381 La Pradera
- 28705 Charreadas
- 28682 Avenida Del Caballo
- 25641 Paseo la Cresta
- 25625 Paseo la Cresta Unit 39
- 25552 Paseo la Vista Unit 20
- 28721 Placida Ave
- 25246 San Michele
- 25102 Camino Del Mar Unit C
- 25072 Leucadia St Unit E
- 25081 Leucadia St Unit F
- 29282 Rue Cerise Unit 7
- 28282 Sorrento Unit 152
- 28282 Sorrento Unit 151
- 28282 Sorrento Unit 145
- 28282 Sorrento Unit 146
- 28282 Sorrento Unit 150
- 28282 Sorrento Unit 148
- 28235 Paseo el Siena
- 28233 Paseo el Siena Unit 39
- 28231 Paseo el Siena Unit 40
- 28237 Paseo el Siena Unit 37
- 28262 Sorrento
- 28262 Sorrento Unit 144
- 28262 Sorrento Unit 143
- 28262 Sorrento
- 28262 Sorrento Unit 138
- 28262 Sorrento Unit 141
- 28262 Sorrento Unit 142
- 28262 Sorrento Unit 140
- 28262 Sorrento Unit 144
- 28262 Sorrento Unit 143