2829 Clay St Alameda, CA 94501
South Shore NeighborhoodEstimated Value: $1,171,000 - $1,387,000
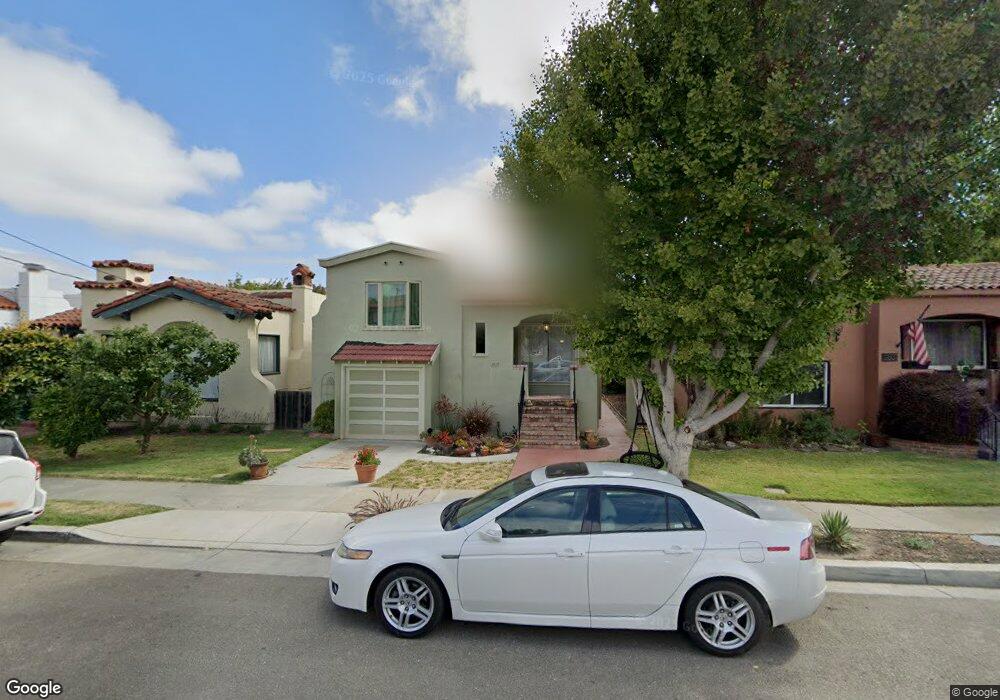
About This Home
This home is located at 2829 Clay St, Alameda, CA 94501 and is currently estimated at $1,259,491, approximately $856 per square foot. 2829 Clay St is a home located in Alameda County with nearby schools including Frank Otis Elementary School, Lincoln Middle School, and Alameda High School.
Ownership History
We collect this data history from publicly available records. To have your information removed, we recommend requesting removal directly through your county’s website.
Purchase Details
Home Financials for this Owner
Home Financials are based on the most recent Mortgage that was taken out on this home.Purchase Details
Home Financials for this Owner
Home Financials are based on the most recent Mortgage that was taken out on this home.Purchase Details
Home Financials for this Owner
Home Financials are based on the most recent Mortgage that was taken out on this home.Purchase Details
Home Financials for this Owner
Home Financials are based on the most recent Mortgage that was taken out on this home.Purchase Details
Home Financials for this Owner
Home Financials are based on the most recent Mortgage that was taken out on this home.Home Values in the Area
Average Home Value in this Area
Purchase History
We collect this data history from publicly available records. To have your information removed, we recommend requesting removal directly through your county’s website.
| Date | Buyer | Sale Price | Title Company |
|---|---|---|---|
| -- | None Available | ||
| -- | First American Title Company | ||
| $297,500 | First American Title Company | ||
| $665,000 | Placer Title Company | ||
| -- | First American Title Lenders | ||
| $558,000 | Chicago Title Co |
Mortgage History
We collect this data history from publicly available records. To have your information removed, we recommend requesting removal directly through your county’s website.
| Date | Status | Borrower | Loan Amount |
|---|---|---|---|
| Closed | $565,100 | ||
| Closed | $75,000 | ||
| Closed | $595,000 | ||
| Closed | $596,000 | ||
| Closed | $598,500 | ||
| Closed | $395,000 | ||
| Closed | $410,000 | ||
| Closed | $417,000 | ||
| Closed | $415,400 | ||
| Closed | $417,000 |
Tax History
We collect this data history from publicly available records. To have your information removed, we recommend requesting removal directly through your county’s website.
| Year | Tax Paid | Tax Assessment Tax Assessment Total Assessment is a certain percentage of the fair market value that is determined by local assessors to be the total taxable value of land and additions on the property. | Land | Improvement |
|---|---|---|---|---|
| 2025 | $11,744 | $816,576 | $244,549 | $579,027 |
| 2024 | $11,744 | $800,431 | $239,755 | $567,676 |
| 2023 | $11,291 | $791,601 | $235,054 | $556,547 |
| 2022 | $11,036 | $769,081 | $230,446 | $545,635 |
| 2021 | $10,694 | $748,041 | $225,929 | $529,112 |
| 2020 | $10,563 | $747,301 | $223,613 | $523,688 |
| 2019 | $10,058 | $732,653 | $219,230 | $513,423 |
| 2018 | $9,804 | $718,292 | $214,933 | $503,359 |
| 2017 | $9,388 | $707,835 | $210,719 | $497,116 |
| 2016 | $9,424 | $695,733 | $206,588 | $489,145 |
| 2015 | $9,394 | $685,286 | $203,486 | $481,800 |
| 2014 | $8,896 | $665,000 | $199,500 | $465,500 |
Map
- 1033 Fountain St
- 3208 Washington St
- 3229 Toyon Terrace
- 339 Broadway Unit 116
- 924 Regent St
- 1121 Peach St
- 301 Broadway Unit 107
- 2860 Jackson St
- 954 Park St
- 2608 Central Ave
- 3103 Central Ave
- 2857 Sea View Pkwy
- 3287 Briggs Ave
- 892 Laurel St
- 2417 Marti Rae Ct
- 1415 Broadway
- 151 Purcell Dr
- 135 Avington Rd
- 2617 Santa Clara Ave
- 63 Sea Bridge
Ask me questions while you tour the home.