Estimated Value: $259,292 - $312,000
3
Beds
3
Baths
1,044
Sq Ft
$275/Sq Ft
Est. Value
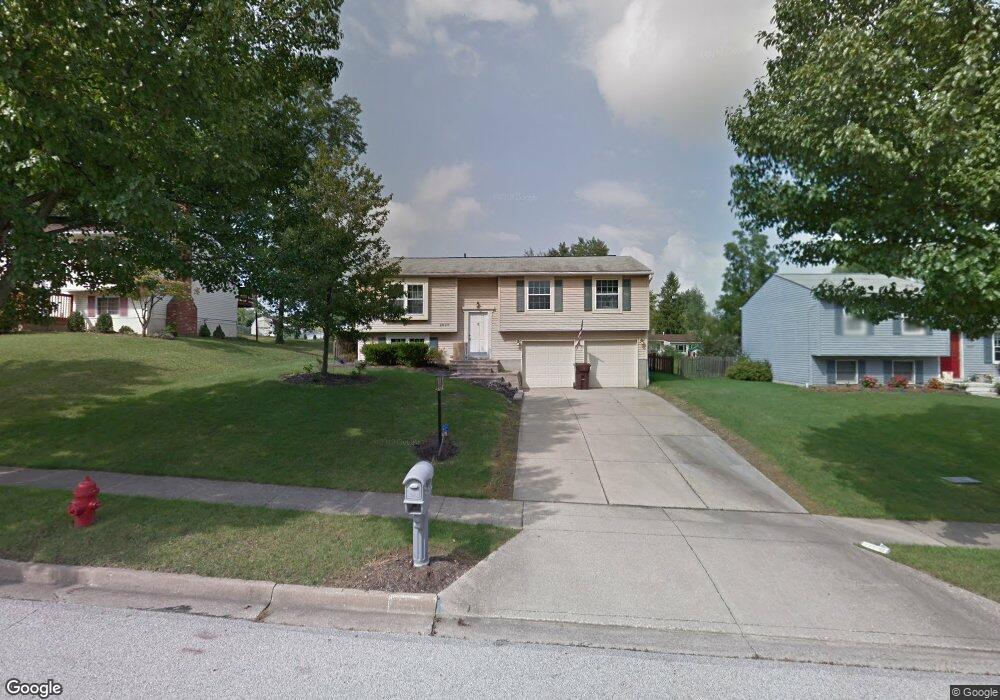
About This Home
This home is located at 2829 E Celeste View Dr, Stow, OH 44224 and is currently estimated at $286,823, approximately $274 per square foot. 2829 E Celeste View Dr is a home located in Summit County with nearby schools including Stow-Munroe Falls High School, Primrose School of Hudson, and Seton Catholic Elementary School.
Ownership History
Date
Name
Owned For
Owner Type
Purchase Details
Closed on
Oct 17, 2014
Sold by
Randall Sean D
Bought by
Hardy Brittaney M and Hardy Charles
Current Estimated Value
Home Financials for this Owner
Home Financials are based on the most recent Mortgage that was taken out on this home.
Original Mortgage
$142,373
Outstanding Balance
$109,749
Interest Rate
4.25%
Mortgage Type
FHA
Estimated Equity
$177,074
Purchase Details
Closed on
Mar 21, 2003
Sold by
Skall Brian M and Skall Cynthia M
Bought by
Randall Sean D
Home Financials for this Owner
Home Financials are based on the most recent Mortgage that was taken out on this home.
Original Mortgage
$118,400
Interest Rate
5.95%
Purchase Details
Closed on
Nov 27, 1996
Sold by
Kriss Al
Bought by
Skall Brian M and Skall Cynthia M
Home Financials for this Owner
Home Financials are based on the most recent Mortgage that was taken out on this home.
Original Mortgage
$79,200
Interest Rate
7.94%
Mortgage Type
New Conventional
Create a Home Valuation Report for This Property
The Home Valuation Report is an in-depth analysis detailing your home's value as well as a comparison with similar homes in the area
Home Values in the Area
Average Home Value in this Area
Purchase History
| Date | Buyer | Sale Price | Title Company |
|---|---|---|---|
| Hardy Brittaney M | $145,000 | Athena Box Village Title | |
| Randall Sean D | $148,000 | -- | |
| Skall Brian M | $99,000 | -- |
Source: Public Records
Mortgage History
| Date | Status | Borrower | Loan Amount |
|---|---|---|---|
| Open | Hardy Brittaney M | $142,373 | |
| Closed | Randall Sean D | $118,400 | |
| Previous Owner | Skall Brian M | $79,200 |
Source: Public Records
Tax History
| Year | Tax Paid | Tax Assessment Tax Assessment Total Assessment is a certain percentage of the fair market value that is determined by local assessors to be the total taxable value of land and additions on the property. | Land | Improvement |
|---|---|---|---|---|
| 2025 | $3,898 | $68,887 | $14,315 | $54,572 |
| 2024 | $3,898 | $68,887 | $14,315 | $54,572 |
| 2023 | $3,898 | $68,887 | $14,315 | $54,572 |
| 2022 | $3,604 | $56,200 | $11,638 | $44,562 |
| 2021 | $3,228 | $56,200 | $11,638 | $44,562 |
| 2020 | $3,173 | $56,200 | $11,640 | $44,560 |
| 2019 | $2,672 | $44,080 | $11,520 | $32,560 |
| 2018 | $2,629 | $44,080 | $11,520 | $32,560 |
| 2017 | $2,702 | $44,080 | $11,520 | $32,560 |
| 2016 | $2,781 | $44,080 | $11,520 | $32,560 |
| 2015 | $2,702 | $44,080 | $11,520 | $32,560 |
| 2014 | $2,705 | $44,080 | $11,520 | $32,560 |
| 2013 | $2,961 | $48,660 | $11,520 | $37,140 |
Source: Public Records
Map
Nearby Homes
- 5361 Diana Lynn Dr
- 1995 Weston Dr
- 4916 Friar Rd Unit B
- 76 Wanda Ct
- 2221 Crockett Cir
- V/L Norton Rd
- 2188 Duxbury
- 4909 Fishcreek Rd
- 5091 Ridge Meadow Dr
- 2279 Becket Cir
- 2908 Wexford Blvd
- 4399-4403 Cherryhurst Dr
- 4556 Fishcreek Rd
- 1620 Sapphire Dr
- 5123 Sodalite Dr
- 4704 Red Willow Rd
- 4623 Cox Dr
- 4424 Timberdale Dr Unit 4428
- 1664 Cypress Ct
- 2353 W Hale Dr
- 2821 E Celeste View Dr
- 2837 E Celeste View Dr
- 2843 E Celeste View Dr
- 2815 E Celeste View Dr
- 2810 E Diana Lynn Dr
- 2802 Diana Lynn Dr
- 5348 Diana Lynn Dr
- 2828 E Celeste View Dr
- 2834 E Celeste View Dr
- 2810 Diana Lynn Dr
- 2820 E Celeste View Dr
- 5372 Lori Vista Dr
- 2840 E Celeste View Dr
- 2816 Diana Lynn Dr
- 2801 E Celeste View Dr
- 5373 Celeste View Dr
- 2812 E Celeste View Dr
- 5384 Lori Vista Dr
- 5381 Celeste View Dr
- 2848 E Celeste View Dr
Your Personal Tour Guide
Ask me questions while you tour the home.