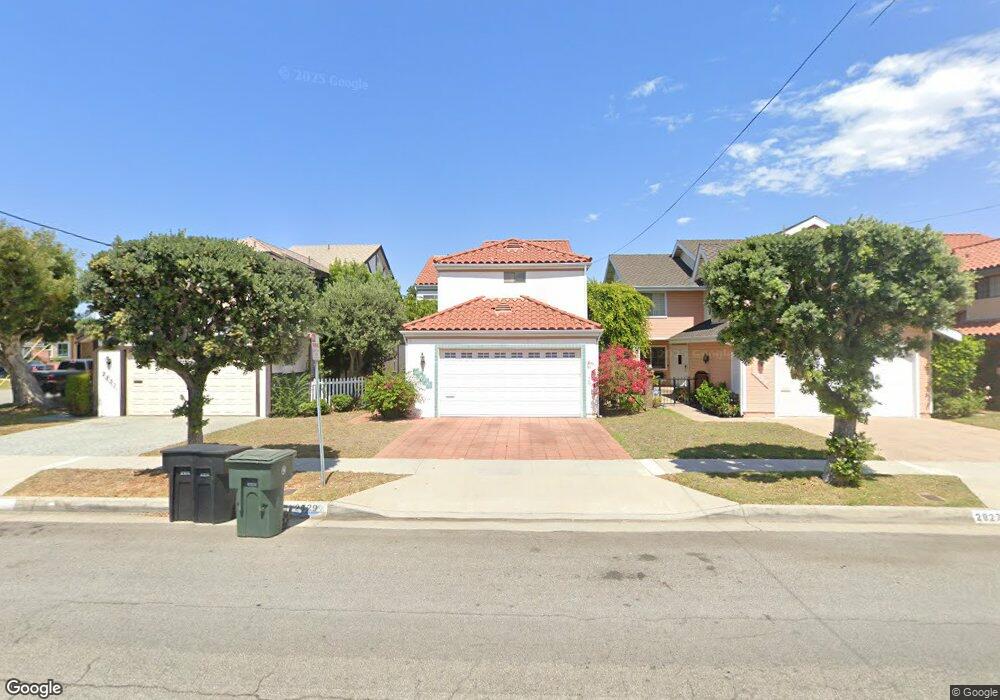
2829 Monterey St Torrance, CA 90503
Central Torrance NeighborhoodEstimated Value: $1,082,390 - $1,243,000
3
Beds
3
Baths
1,938
Sq Ft
$584/Sq Ft
Est. Value
About This Home
This home is located at 2829 Monterey St, Torrance, CA 90503 and is currently estimated at $1,132,598, approximately $584 per square foot. 2829 Monterey St is a home located in Los Angeles County with nearby schools including Fern Elementary School, Madrona Middle School, and Torrance High School.
Ownership History
Date
Name
Owned For
Owner Type
Purchase Details
Closed on
Oct 15, 2010
Sold by
An Bo
Bought by
Buterakos Venetia and Buterakos Takis
Current Estimated Value
Home Financials for this Owner
Home Financials are based on the most recent Mortgage that was taken out on this home.
Original Mortgage
$417,000
Outstanding Balance
$274,053
Interest Rate
4.27%
Mortgage Type
New Conventional
Estimated Equity
$858,545
Purchase Details
Closed on
Dec 27, 2001
Sold by
Lee Sarah Sunhee
Bought by
An Bo and An Sarah
Home Financials for this Owner
Home Financials are based on the most recent Mortgage that was taken out on this home.
Original Mortgage
$294,000
Interest Rate
6.73%
Purchase Details
Closed on
May 21, 1998
Sold by
Forsgren Robert A
Bought by
Lee Sarah Sunhee and Ann Bo
Home Financials for this Owner
Home Financials are based on the most recent Mortgage that was taken out on this home.
Original Mortgage
$274,000
Interest Rate
7.13%
Create a Home Valuation Report for This Property
The Home Valuation Report is an in-depth analysis detailing your home's value as well as a comparison with similar homes in the area
Home Values in the Area
Average Home Value in this Area
Purchase History
| Date | Buyer | Sale Price | Title Company |
|---|---|---|---|
| Buterakos Venetia | $635,000 | Priority Title | |
| An Bo | -- | -- | |
| Lee Sarah Sunhee | $342,500 | -- |
Source: Public Records
Mortgage History
| Date | Status | Borrower | Loan Amount |
|---|---|---|---|
| Open | Buterakos Venetia | $417,000 | |
| Previous Owner | An Bo | $294,000 | |
| Previous Owner | Lee Sarah Sunhee | $274,000 | |
| Closed | Lee Sarah Sunhee | $34,200 |
Source: Public Records
Tax History
| Year | Tax Paid | Tax Assessment Tax Assessment Total Assessment is a certain percentage of the fair market value that is determined by local assessors to be the total taxable value of land and additions on the property. | Land | Improvement |
|---|---|---|---|---|
| 2025 | $9,232 | $813,536 | $544,495 | $269,041 |
| 2024 | $9,232 | $797,585 | $533,819 | $263,766 |
| 2023 | $9,062 | $781,947 | $523,352 | $258,595 |
| 2022 | $8,942 | $766,616 | $513,091 | $253,525 |
| 2021 | $8,778 | $751,585 | $503,031 | $248,554 |
| 2019 | $8,524 | $729,295 | $488,112 | $241,183 |
| 2018 | $8,274 | $714,996 | $478,542 | $236,454 |
| 2016 | $7,904 | $687,233 | $459,960 | $227,273 |
| 2015 | $7,733 | $676,911 | $453,051 | $223,860 |
| 2014 | $7,530 | $663,652 | $444,177 | $219,475 |
Source: Public Records
Map
Nearby Homes
- 2940 W Carson St Unit 213
- 2751 Sonoma St
- 2300 Maple Ave Unit 80
- 2300 Maple Ave Unit 140
- 2300 Maple Ave Unit 58
- 2300 Maple Ave Unit 26
- 2615 Plaza Del Amo Unit 606
- 2595 Plaza Del Amo Unit 424
- 2571 Plaza Del Amo Unit 107
- 1509 Elm Ave
- 2128 Shelburne Way
- 1307 Greenwood Ave
- 1325 Florwood Ave
- 3120 Sepulveda Blvd Unit 412
- 3120 Sepulveda Blvd Unit 306
- 2605 Sepulveda Blvd Unit 216
- 22314 Avis Ct
- 2349 Jefferson St Unit 313
- 22313 Osage Ct
- 22741 Nadine Cir Unit B
- 2831 Monterey St
- 2827 Monterey St
- 2825 Monterey St
- 1746 Juniper Ave
- 1748 S Juniper Ave
- 1742 Juniper Ave
- 2811 Monterey St
- 1755 Juniper Ave
- 1734 Juniper Ave
- 1751 Iris Ave
- 2855 Monterey St
- 1741 Iris Ave
- 1755 Iris Ave
- 1747 Juniper Ave
- 1730 Juniper Ave
- 1741 Juniper Ave
- 1735 Iris Ave
- 2859 Monterey St
- 1735 Juniper Ave
- 1728 Juniper Ave Unit 2
Your Personal Tour Guide
Ask me questions while you tour the home.