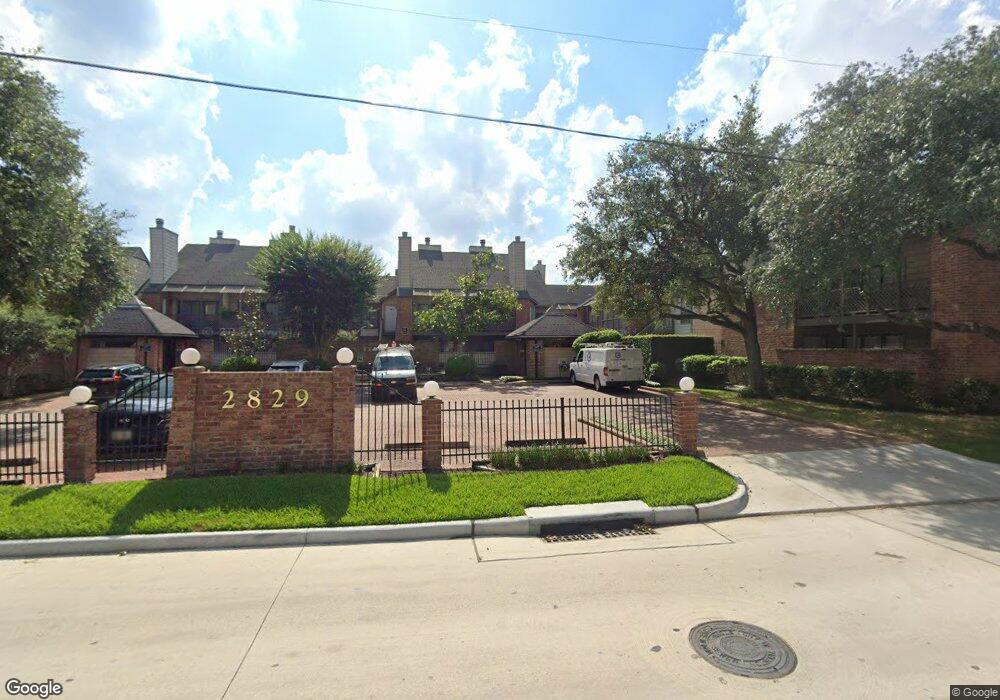
2829 Timmons Ln Unit 1 Houston, TX 77027
River Oaks NeighborhoodEstimated Value: $216,000 - $277,000
1
Bed
2
Baths
1,018
Sq Ft
$254/Sq Ft
Est. Value
About This Home
This home is located at 2829 Timmons Ln Unit 1, Houston, TX 77027 and is currently estimated at $258,114, approximately $253 per square foot. 2829 Timmons Ln Unit 1 is a home located in Harris County with nearby schools including Poe Elementary School, Lanier Middle School, and Lamar High School.
Ownership History
Date
Name
Owned For
Owner Type
Purchase Details
Closed on
May 29, 2015
Sold by
Fowler Erik and Craig Cassandra
Bought by
Odom Brandi
Current Estimated Value
Home Financials for this Owner
Home Financials are based on the most recent Mortgage that was taken out on this home.
Original Mortgage
$166,250
Outstanding Balance
$128,535
Interest Rate
3.7%
Mortgage Type
New Conventional
Estimated Equity
$129,579
Purchase Details
Closed on
Feb 13, 2007
Sold by
Evans Stephen
Bought by
Fowler Erik
Home Financials for this Owner
Home Financials are based on the most recent Mortgage that was taken out on this home.
Original Mortgage
$13,100
Interest Rate
6.21%
Mortgage Type
Stand Alone Second
Purchase Details
Closed on
Oct 29, 1998
Sold by
Heronemus Ellen Hill and Heronemus Ellen
Bought by
Elliott Bradley D
Home Financials for this Owner
Home Financials are based on the most recent Mortgage that was taken out on this home.
Original Mortgage
$69,350
Interest Rate
6.61%
Create a Home Valuation Report for This Property
The Home Valuation Report is an in-depth analysis detailing your home's value as well as a comparison with similar homes in the area
Home Values in the Area
Average Home Value in this Area
Purchase History
| Date | Buyer | Sale Price | Title Company |
|---|---|---|---|
| Odom Brandi | -- | None Available | |
| Fowler Erik | -- | Etc | |
| Elliott Bradley D | -- | Stewart Title Company |
Source: Public Records
Mortgage History
| Date | Status | Borrower | Loan Amount |
|---|---|---|---|
| Open | Odom Brandi | $166,250 | |
| Previous Owner | Fowler Erik | $13,100 | |
| Previous Owner | Fowler Erik | $104,600 | |
| Previous Owner | Elliott Bradley D | $69,350 |
Source: Public Records
Tax History Compared to Growth
Tax History
| Year | Tax Paid | Tax Assessment Tax Assessment Total Assessment is a certain percentage of the fair market value that is determined by local assessors to be the total taxable value of land and additions on the property. | Land | Improvement |
|---|---|---|---|---|
| 2025 | $1,078 | $181,350 | $34,457 | $146,893 |
| 2024 | $1,078 | $177,612 | $33,746 | $143,866 |
| 2023 | $1,078 | $117,199 | $22,268 | $94,931 |
| 2022 | $4,016 | $182,410 | $37,712 | $144,698 |
| 2021 | $4,155 | $178,296 | $36,419 | $141,877 |
| 2020 | $3,957 | $163,405 | $38,177 | $125,228 |
| 2019 | $4,515 | $191,611 | $38,177 | $153,434 |
| 2018 | $2,998 | $162,219 | $31,201 | $131,018 |
| 2017 | $4,152 | $164,216 | $31,201 | $133,015 |
| 2016 | $4,152 | $164,216 | $31,201 | $133,015 |
| 2015 | $3,163 | $164,216 | $31,201 | $133,015 |
| 2014 | $3,163 | $177,745 | $33,772 | $143,973 |
Source: Public Records
Map
Nearby Homes
- 2829 Timmons Ln Unit 199
- 2829 Timmons Ln Unit 202
- 2829 Timmons Ln Unit 206
- 2829 Timmons Ln Unit 209
- 2829 Timmons Ln Unit 161
- 2829 Timmons Ln Unit 184
- 2829 Timmons Ln Unit 167
- 2908 Saint St
- 1 Alabama Ct
- 2711 Eastgrove Ln
- 3131 Cummins St Unit 79
- 3131 Cummins St Unit 86
- 3131 Cummins St Unit 18
- 3131 Cummins St Unit 27
- 3131 Cummins St Unit 87
- 2706 Eastgrove Ln
- 2822 Westgrove Ln
- 2703 Westgrove Ln
- 2610 Westgrove Ln
- 3224 Timmons Ln Unit 106
- 2829 Timmons Ln Unit 2
- 2829 Timmons Ln Unit 2
- 2829 Timmons Ln Unit 2
- 2829 Timmons Ln Unit 2
- 2829 Timmons Ln Unit 2
- 2829 Timmons Ln Unit 2
- 2829 Timmons Ln Unit 1
- 2829 Timmons Ln Unit 2
- 2829 Timmons Ln Unit 2
- 2829 Timmons Ln Unit 2
- 2829 Timmons Ln Unit 2
- 2829 Timmons Ln Unit 2
- 2829 Timmons Ln Unit 2
- 2829 Timmons Ln Unit 2
- 2829 Timmons Ln Unit 2
- 2829 Timmons Ln Unit 2
- 2829 Timmons Ln Unit 2
- 2829 Timmons Ln Unit 2
- 2829 Timmons Ln Unit 2
- 2829 Timmons Ln Unit 2