Estimated Value: $2,166,000 - $2,504,000
4
Beds
3
Baths
2,509
Sq Ft
$911/Sq Ft
Est. Value
About This Home
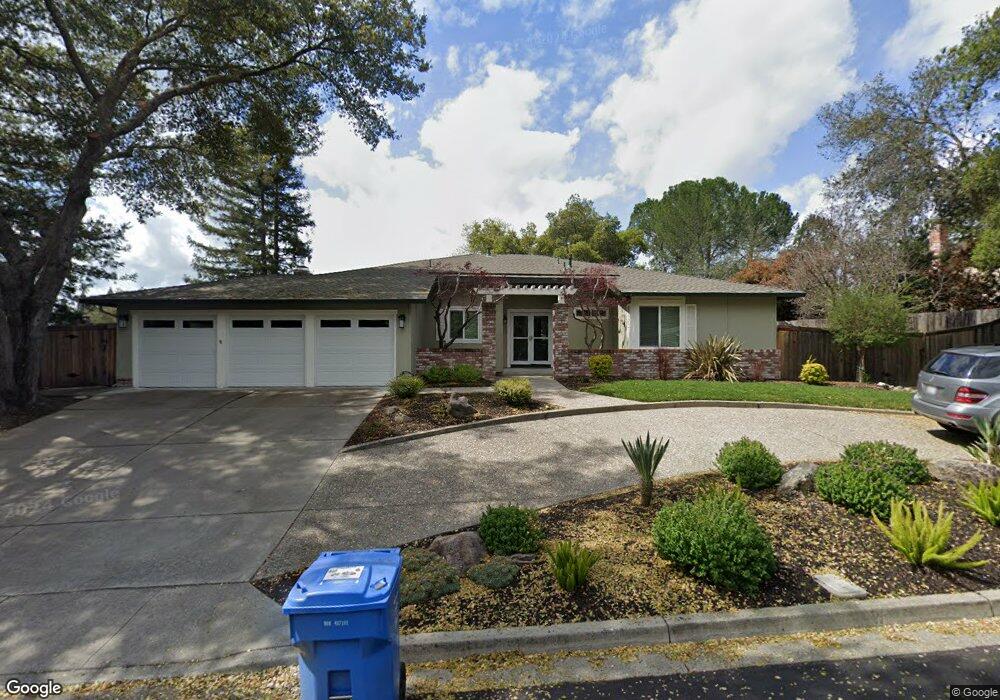
This home is located at 283 Davey Crockett Ct, Alamo, CA 94507 and is currently estimated at $2,284,455, approximately $910 per square foot. 283 Davey Crockett Ct is a home located in Contra Costa County with nearby schools including Alamo Elementary School, Stone Valley Middle School, and Monte Vista High School.
Ownership History
Date
Name
Owned For
Owner Type
Purchase Details
Closed on
Aug 23, 2018
Sold by
Joslin Bryan and Joslin Kate N
Bought by
Rogers Jeanine and Rogers Sean P
Current Estimated Value
Home Financials for this Owner
Home Financials are based on the most recent Mortgage that was taken out on this home.
Original Mortgage
$1,100,000
Outstanding Balance
$955,305
Interest Rate
4.5%
Mortgage Type
New Conventional
Estimated Equity
$1,329,150
Purchase Details
Closed on
Jun 25, 2015
Sold by
Gettle Francis S
Bought by
Joslin Bryan and Joslin Kate N
Home Financials for this Owner
Home Financials are based on the most recent Mortgage that was taken out on this home.
Original Mortgage
$625,500
Interest Rate
3.81%
Mortgage Type
New Conventional
Purchase Details
Closed on
Nov 22, 1993
Sold by
Gettle Francis S and Gettle Patricia K
Bought by
Gettle Francis S and Gettle Patricia K
Create a Home Valuation Report for This Property
The Home Valuation Report is an in-depth analysis detailing your home's value as well as a comparison with similar homes in the area
Home Values in the Area
Average Home Value in this Area
Purchase History
| Date | Buyer | Sale Price | Title Company |
|---|---|---|---|
| Rogers Jeanine | $1,700,000 | Chicago Title Company | |
| Joslin Bryan | $1,275,000 | Chicago Title Company | |
| Gettle Francis S | -- | -- |
Source: Public Records
Mortgage History
| Date | Status | Borrower | Loan Amount |
|---|---|---|---|
| Open | Rogers Jeanine | $1,100,000 | |
| Previous Owner | Joslin Bryan | $625,500 |
Source: Public Records
Tax History
| Year | Tax Paid | Tax Assessment Tax Assessment Total Assessment is a certain percentage of the fair market value that is determined by local assessors to be the total taxable value of land and additions on the property. | Land | Improvement |
|---|---|---|---|---|
| 2025 | $22,485 | $1,978,402 | $1,115,517 | $862,885 |
| 2024 | $21,701 | $1,939,611 | $1,093,645 | $845,966 |
| 2023 | $21,701 | $1,901,580 | $1,072,201 | $829,379 |
| 2022 | $21,541 | $1,864,295 | $1,051,178 | $813,117 |
| 2021 | $21,089 | $1,827,741 | $1,030,567 | $797,174 |
| 2019 | $19,820 | $1,700,000 | $1,000,000 | $700,000 |
| 2018 | $15,259 | $1,326,510 | $884,340 | $442,170 |
| 2017 | $14,705 | $1,300,500 | $867,000 | $433,500 |
| 2016 | $14,534 | $1,275,000 | $850,000 | $425,000 |
| 2015 | $3,802 | $303,623 | $151,811 | $151,812 |
| 2014 | $3,732 | $297,677 | $148,838 | $148,839 |
Source: Public Records
Map
Nearby Homes
- 320 Miranda Ln
- 908 Gibson Ct
- 401 Legacy Dr
- 321 Livorna Heights Rd
- 44 Lariat Ct
- 2257 Gladwin Dr
- 218 Erselia Trail
- 930 Pinto Ct
- 1536 Serafix Rd
- 13 Kemp Ct
- 1109 Cardigan Dr
- 2103 Dapplegray Ln
- 1977 Woodbury Ct
- 1950 Whitecliff Ct
- 1923 Whitecliff Way
- 3144 Roundhill Rd
- 46 Tam o Shanter Rd
- 34 Sugarloaf Terrace
- 136 Sugarloaf Ct
- 172 Sugarloaf Ct
- 281 Davey Crockett Ct
- 285 Davey Crockett Ct
- 810 Turner Ct
- 802 Turner Ct
- 712 Evelyn Ct
- 398 James Bowie Ct
- 397 James Bowie Ct
- 291 Davey Crockett Ct
- 275 Davey Crockett Ct
- 720 Evelyn Ct
- 292 Davey Crockett Ct
- 818 Turner Ct
- 269 Davey Crockett Ct
- 391 James Bowie Ct
- 297 Davey Crockett Ct
- 274 Davey Crockett Ct
- 268 Davey Crockett Ct
- 809 Turner Ct
- 801 Turner Ct
- 711 Evelyn Ct
Your Personal Tour Guide
Ask me questions while you tour the home.