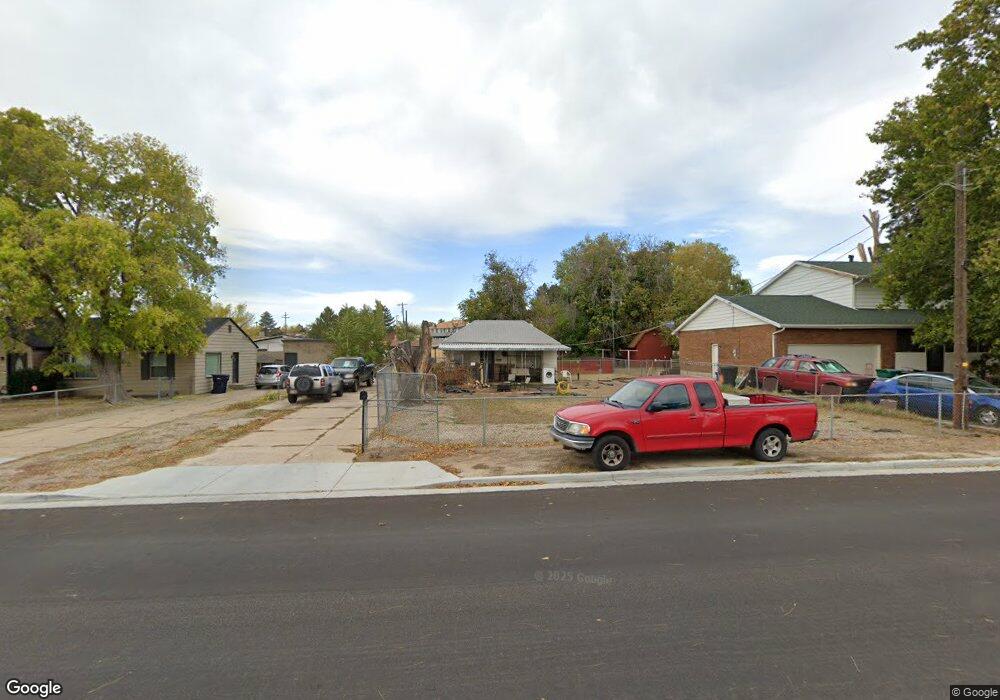
283 E 300 N Clearfield, UT 84015
Estimated Value: $321,000 - $341,000
2
Beds
1
Bath
769
Sq Ft
$434/Sq Ft
Est. Value
About This Home
This home is located at 283 E 300 N, Clearfield, UT 84015 and is currently estimated at $334,083, approximately $434 per square foot. 283 E 300 N is a home located in Davis County with nearby schools including Wasatch Elementary School, North Davis Junior High School, and Clearfield High School.
Ownership History
Date
Name
Owned For
Owner Type
Purchase Details
Closed on
Oct 3, 2025
Sold by
Davis And Weber Counties Canal Company
Bought by
Davis And Weber Counties Canal Company
Current Estimated Value
Purchase Details
Closed on
Jul 5, 2019
Sold by
Roberts Kami
Bought by
Campbell Brian and Campbell Kylie
Purchase Details
Closed on
Aug 15, 2007
Sold by
Peterson Austin J
Bought by
Roberts Kami
Home Financials for this Owner
Home Financials are based on the most recent Mortgage that was taken out on this home.
Original Mortgage
$96,500
Interest Rate
6.73%
Mortgage Type
Purchase Money Mortgage
Purchase Details
Closed on
Jan 2, 2001
Sold by
Heaps David L and Heaps Linda K
Bought by
Peterson Austin J
Home Financials for this Owner
Home Financials are based on the most recent Mortgage that was taken out on this home.
Original Mortgage
$66,833
Interest Rate
7.71%
Purchase Details
Closed on
Apr 15, 1996
Sold by
Heaps David L
Bought by
Heaps David L and Heaps Linda K
Create a Home Valuation Report for This Property
The Home Valuation Report is an in-depth analysis detailing your home's value as well as a comparison with similar homes in the area
Home Values in the Area
Average Home Value in this Area
Purchase History
| Date | Buyer | Sale Price | Title Company |
|---|---|---|---|
| Davis And Weber Counties Canal Company | -- | None Listed On Document | |
| Campbell Brian | -- | Vanguard Title Ins | |
| Roberts Kami | -- | Us Title Company Of Utah | |
| Peterson Austin J | -- | Backman Stewart Title Servic | |
| Heaps David L | -- | -- |
Source: Public Records
Mortgage History
| Date | Status | Borrower | Loan Amount |
|---|---|---|---|
| Previous Owner | Roberts Kami | $96,500 | |
| Previous Owner | Peterson Austin J | $66,833 |
Source: Public Records
Tax History
| Year | Tax Paid | Tax Assessment Tax Assessment Total Assessment is a certain percentage of the fair market value that is determined by local assessors to be the total taxable value of land and additions on the property. | Land | Improvement |
|---|---|---|---|---|
| 2025 | $1,639 | $146,850 | $105,732 | $41,118 |
| 2024 | $1,609 | $145,199 | $100,795 | $44,404 |
| 2023 | $1,497 | $136,400 | $86,547 | $49,852 |
| 2022 | $1,479 | $241,000 | $157,388 | $83,612 |
| 2021 | $1,359 | $184,000 | $113,030 | $70,970 |
| 2020 | $1,175 | $158,000 | $99,491 | $58,509 |
| 2019 | $1,107 | $147,000 | $88,804 | $58,196 |
| 2018 | $982 | $127,000 | $74,882 | $52,118 |
| 2016 | $835 | $56,430 | $32,902 | $23,528 |
| 2015 | $787 | $50,710 | $32,902 | $17,808 |
| 2014 | $799 | $52,191 | $32,902 | $19,289 |
| 2013 | -- | $53,148 | $34,357 | $18,791 |
Source: Public Records
Map
Nearby Homes
- 230 S Lakeview Dr
- 446 Fern Dr
- 206 E 100 N
- 328 E 100 N
- 285 N Main St Unit 308
- 111 Center St Unit 6A
- 54 W 250 N
- 15 S 400 E
- 51 S 400 E
- 156 W 300 N
- 75 W 250 N Unit 78
- 75 W 250 N Unit 31
- 75 W 250 N Unit 110
- 75 W 250 N Unit 56
- 75 W 250 N Unit 84
- 75 W 250 N Unit 13
- 137 W 250 N
- 62 Villa Dr
- 47 Villa Dr
- 83 W 650 N
Your Personal Tour Guide
Ask me questions while you tour the home.