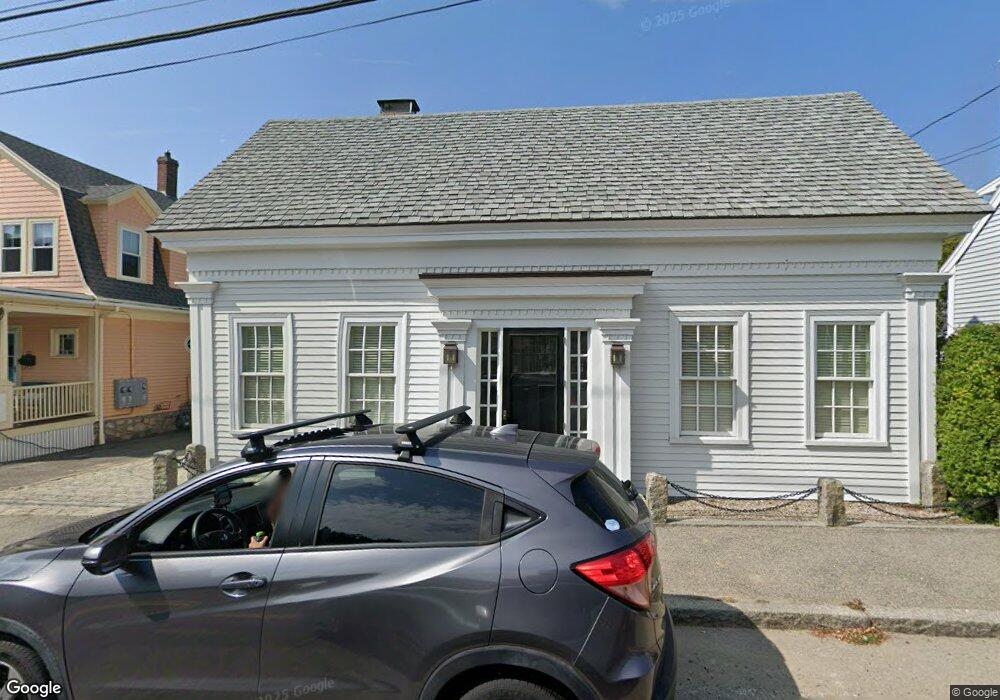
283 E Main St Gloucester, MA 01930
East Gloucester NeighborhoodEstimated Value: $741,000 - $1,394,000
2
Beds
2
Baths
1,134
Sq Ft
$847/Sq Ft
Est. Value
About This Home
This home is located at 283 E Main St, Gloucester, MA 01930 and is currently estimated at $960,531, approximately $847 per square foot. 283 E Main St is a home located in Essex County with nearby schools including East Gloucester Elementary School, Ralph B O'maley Middle School, and Gloucester High School.
Ownership History
Date
Name
Owned For
Owner Type
Purchase Details
Closed on
Oct 1, 2001
Sold by
Mcphee Harold Ray and Mcphee Sherman N
Bought by
Sobell Jeffrey M and Kuvalanka Kyle D
Current Estimated Value
Home Financials for this Owner
Home Financials are based on the most recent Mortgage that was taken out on this home.
Original Mortgage
$275,000
Interest Rate
6.91%
Mortgage Type
Purchase Money Mortgage
Create a Home Valuation Report for This Property
The Home Valuation Report is an in-depth analysis detailing your home's value as well as a comparison with similar homes in the area
Home Values in the Area
Average Home Value in this Area
Purchase History
| Date | Buyer | Sale Price | Title Company |
|---|---|---|---|
| Sobell Jeffrey M | $379,000 | -- |
Source: Public Records
Mortgage History
| Date | Status | Borrower | Loan Amount |
|---|---|---|---|
| Open | Sobell Jeffrey M | $275,000 | |
| Closed | Sobell Jeffrey M | $275,000 |
Source: Public Records
Tax History
| Year | Tax Paid | Tax Assessment Tax Assessment Total Assessment is a certain percentage of the fair market value that is determined by local assessors to be the total taxable value of land and additions on the property. | Land | Improvement |
|---|---|---|---|---|
| 2025 | $7,738 | $796,100 | $449,800 | $346,300 |
| 2024 | $7,637 | $784,900 | $428,300 | $356,600 |
| 2023 | $7,417 | $700,400 | $382,500 | $317,900 |
| 2022 | $6,875 | $586,100 | $332,600 | $253,500 |
| 2021 | $6,833 | $549,300 | $302,300 | $247,000 |
| 2020 | $6,356 | $515,500 | $285,100 | $230,400 |
| 2019 | $6,326 | $498,500 | $285,100 | $213,400 |
| 2018 | $6,227 | $481,600 | $285,100 | $196,500 |
| 2017 | $6,005 | $455,300 | $271,600 | $183,700 |
| 2016 | $5,748 | $422,300 | $257,600 | $164,700 |
| 2015 | $5,592 | $409,700 | $257,600 | $152,100 |
Source: Public Records
Map
Nearby Homes
- 1 Wonson St
- 15 Raven Ln Unit 15
- 73 Rocky Neck Ave Unit 2
- 60 Rocky Neck Ave Unit 202
- 197 E Main St Unit 1
- 10 Seaview Rd
- 30 Chapel St Unit B
- 11 Ocean View Dr
- 191 Main St Unit 3
- 191 Main St Unit 2A
- 35 Middle St Unit 4
- 33 Middle St
- 139A Prospect St
- 15 Mount Vernon St
- 3 Mondello Square
- 113 Pleasant St
- 33 Maplewood Ave Unit 310
- 20 Beacon St
- 20 Beacon St Unit 2
- 20 Beacon St Unit 1
- 285 E Main St
- 281 E Main St
- 5 Rocky Neck Ave
- 5A Rocky Neck Ave
- 5 Rocky Neck Ave Unit A
- 252 E Main St
- 260 E Main St Unit 3
- 260 E Main St Unit 2
- 260 E Main St
- 260 E Main St Unit 1
- 10 Fisherman Way
- 8 Fisherman Way
- 250 E Main St
- 262 E Main St
- 1 Eastern Point Rd Unit 4
- 1 Eastern Point Rd Unit 2
- 1 Eastern Point Rd Unit 1
- 2 Rocky Neck Ave Unit A
- 2 Rocky Neck Ave Unit B
- 2 Rocky Neck Ave
Your Personal Tour Guide
Ask me questions while you tour the home.