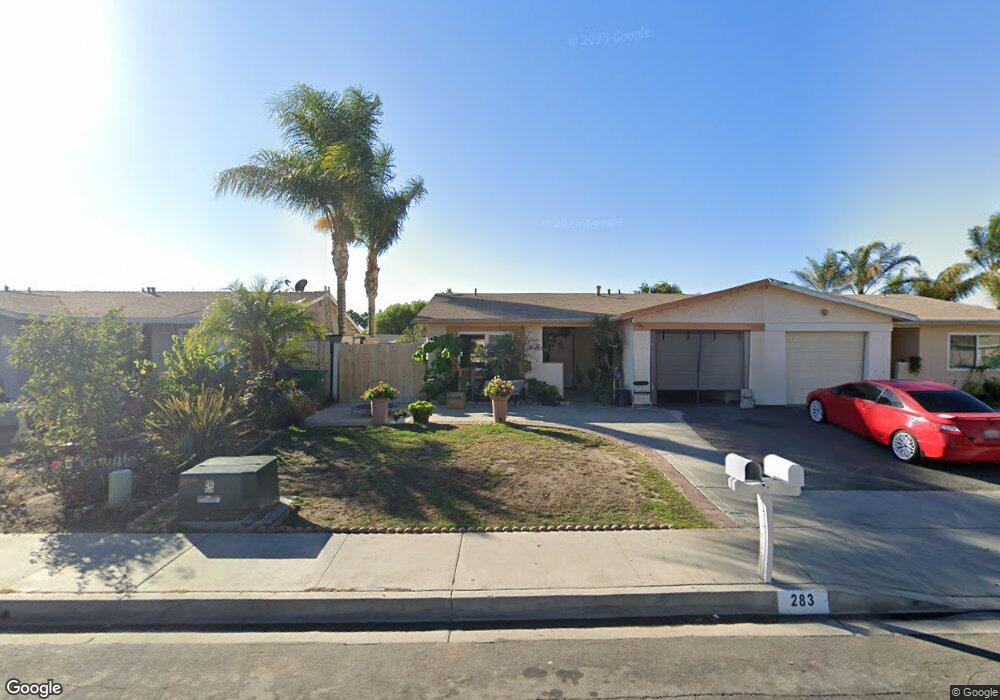
283 Lustrosos St Oceanside, CA 92057
North Valley NeighborhoodEstimated Value: $537,274 - $593,000
2
Beds
1
Bath
820
Sq Ft
$697/Sq Ft
Est. Value
About This Home
This home is located at 283 Lustrosos St, Oceanside, CA 92057 and is currently estimated at $571,319, approximately $696 per square foot. 283 Lustrosos St is a home located in San Diego County with nearby schools including Reynolds Elementary School, Martin Luther King Jr. Middle School, and El Camino High School.
Ownership History
Date
Name
Owned For
Owner Type
Purchase Details
Closed on
Dec 14, 2010
Sold by
Cortes Jesuita
Bought by
Cortes Carlos
Current Estimated Value
Purchase Details
Closed on
Sep 24, 1998
Sold by
Carlos Cortes
Bought by
Cortes Carlos and Cortes Jesuita
Home Financials for this Owner
Home Financials are based on the most recent Mortgage that was taken out on this home.
Original Mortgage
$82,990
Interest Rate
6.88%
Mortgage Type
FHA
Purchase Details
Closed on
Nov 2, 1994
Sold by
Castellanos Jesucita Mata
Bought by
Cortes Carlos
Home Financials for this Owner
Home Financials are based on the most recent Mortgage that was taken out on this home.
Original Mortgage
$81,902
Interest Rate
8.91%
Mortgage Type
FHA
Purchase Details
Closed on
Oct 25, 1994
Sold by
Acks Adaline C
Bought by
Cortes Carlos
Home Financials for this Owner
Home Financials are based on the most recent Mortgage that was taken out on this home.
Original Mortgage
$81,902
Interest Rate
8.91%
Mortgage Type
FHA
Create a Home Valuation Report for This Property
The Home Valuation Report is an in-depth analysis detailing your home's value as well as a comparison with similar homes in the area
Home Values in the Area
Average Home Value in this Area
Purchase History
| Date | Buyer | Sale Price | Title Company |
|---|---|---|---|
| Cortes Carlos | -- | None Available | |
| Cortes Carlos | -- | Southland Title Company | |
| Cortes Carlos | -- | First American Title Co | |
| Cortes Carlos | $82,000 | First American Title Company |
Source: Public Records
Mortgage History
| Date | Status | Borrower | Loan Amount |
|---|---|---|---|
| Closed | Cortes Carlos | $82,990 | |
| Closed | Cortes Carlos | $81,902 |
Source: Public Records
Tax History
| Year | Tax Paid | Tax Assessment Tax Assessment Total Assessment is a certain percentage of the fair market value that is determined by local assessors to be the total taxable value of land and additions on the property. | Land | Improvement |
|---|---|---|---|---|
| 2025 | $1,580 | $146,657 | $34,752 | $111,905 |
| 2024 | $1,580 | $143,782 | $34,071 | $109,711 |
| 2023 | $1,530 | $140,963 | $33,403 | $107,560 |
| 2022 | $1,506 | $138,200 | $32,749 | $105,451 |
| 2021 | $1,510 | $135,491 | $32,107 | $103,384 |
| 2020 | $1,464 | $134,102 | $31,778 | $102,324 |
| 2019 | $1,421 | $131,473 | $31,155 | $100,318 |
| 2018 | $1,482 | $128,896 | $30,545 | $98,351 |
| 2017 | $1,455 | $126,370 | $29,947 | $96,423 |
| 2016 | $1,408 | $123,893 | $29,360 | $94,533 |
| 2015 | $1,368 | $122,033 | $28,919 | $93,114 |
| 2014 | $1,317 | $119,644 | $28,353 | $91,291 |
Source: Public Records
Map
Nearby Homes
- 4658 Calle de Retiro
- 514 Calle Montecito Unit 78
- 517 Calle Montecito Unit 91
- 525 Calle Montecito Unit 122
- 518 Calle Montecito Unit 95
- 522 Calle Montecito Unit 114
- 265 Securidad St
- 4781 Calle Las Positas
- 4660 N River Rd Unit 150
- 4660 N River Rd Unit 136
- 4660 N River Rd Unit 17
- 4608 Calle de Retiro
- 4655 Caneel Bay Ct
- 4745 Marblehead Bay Dr
- 4798 Calle Los Santos
- 4616 N River Rd Unit 8
- 4616 N River Rd Unit SPC 68
- 4750 Calle Estrella
- 4621 Avery St
- 361 Point Windemere Place
- 281 Lustrosos St
- 285 Lustrosos St
- 279 Lustrosos St
- 287 Lustrosos St
- 348 Avenida Descanso
- 344 Avenida Descanso
- 342 Avenida Descanso
- 350 Avenida Descanso
- 277 Lustrosos St
- 289 Lustrosos St
- 352 Avenida Descanso
- 284 Lustrosos St
- 280 Lustrosos St
- 275 Lustrosos St
- 291 Lustrosos St
- 346 Avenida Descanso
- 286 Lustrosos St
- 278 Lustrosos St
- 340 Avenida Descanso
- 354 Avenida Descanso
Your Personal Tour Guide
Ask me questions while you tour the home.