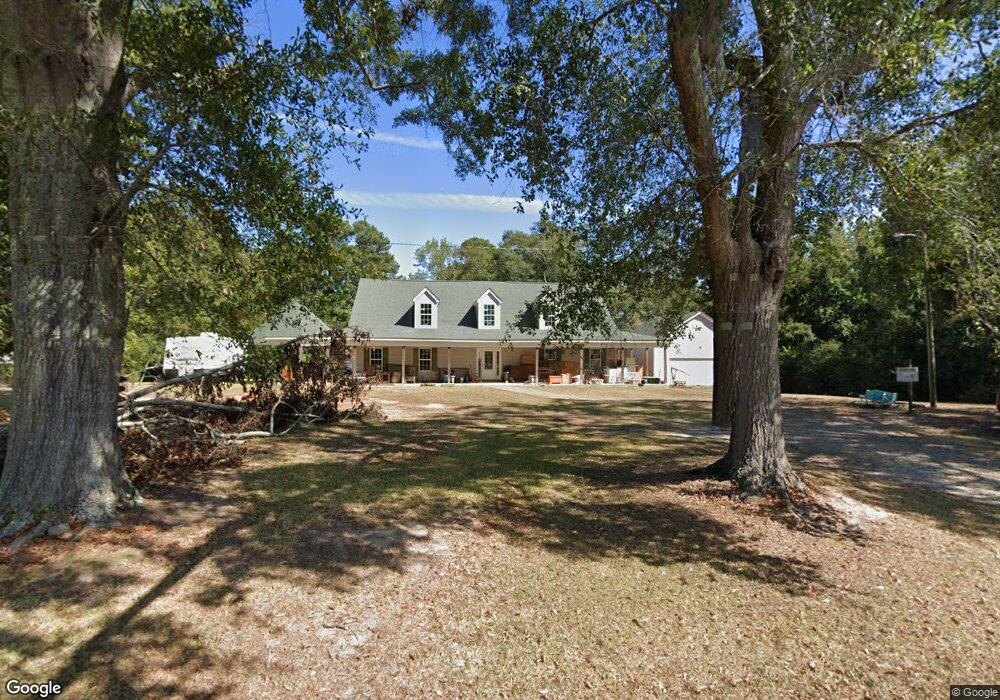
283 Old Milner Rd Unit 7 Barnesville, GA 30204
Estimated Value: $360,000 - $461,000
4
Beds
2
Baths
3,306
Sq Ft
$124/Sq Ft
Est. Value
About This Home
This home is located at 283 Old Milner Rd Unit 7, Barnesville, GA 30204 and is currently estimated at $409,261, approximately $123 per square foot. 283 Old Milner Rd Unit 7 is a home located in Lamar County with nearby schools including Lamar County Primary School, Lamar County Elementary School, and Lamar County Middle School.
Ownership History
Date
Name
Owned For
Owner Type
Purchase Details
Closed on
Oct 6, 2016
Sold by
Colquitt Keith G
Bought by
Brooks Joe T and Brooks Dana
Current Estimated Value
Purchase Details
Closed on
Jun 5, 2016
Sold by
Colquitt Carol A
Bought by
Colquitt Keith G
Purchase Details
Closed on
Oct 9, 2009
Sold by
Coffey Patsy
Bought by
Colquitt Keith G
Home Financials for this Owner
Home Financials are based on the most recent Mortgage that was taken out on this home.
Original Mortgage
$119,000
Interest Rate
5.1%
Mortgage Type
New Conventional
Purchase Details
Closed on
Apr 3, 2006
Sold by
Not Provided
Bought by
Colquitt Keith G and Colquitt Carol A
Purchase Details
Closed on
Jul 5, 2001
Sold by
Nix James T
Bought by
Horne Amanda A and Horne Joshua E
Purchase Details
Closed on
Sep 1, 1991
Sold by
Batchelor Michele
Bought by
Nix James T
Create a Home Valuation Report for This Property
The Home Valuation Report is an in-depth analysis detailing your home's value as well as a comparison with similar homes in the area
Purchase History
| Date | Buyer | Sale Price | Title Company |
|---|---|---|---|
| Brooks Joe T | $58,000 | -- | |
| Colquitt Keith G | -- | -- | |
| Colquitt Keith G | $120,000 | -- | |
| Colquitt Keith G | $120,000 | -- | |
| Colquitt Keith G | $105,000 | -- | |
| Horne Amanda A | $80,000 | -- | |
| Nix James T | $38,000 | -- |
Source: Public Records
Mortgage History
| Date | Status | Borrower | Loan Amount |
|---|---|---|---|
| Previous Owner | Colquitt Keith G | $119,000 |
Source: Public Records
Tax History
| Year | Tax Paid | Tax Assessment Tax Assessment Total Assessment is a certain percentage of the fair market value that is determined by local assessors to be the total taxable value of land and additions on the property. | Land | Improvement |
|---|---|---|---|---|
| 2025 | $3,425 | $153,650 | $8,286 | $145,364 |
| 2024 | $3,233 | $128,206 | $8,286 | $119,920 |
| 2023 | $3,487 | $128,206 | $8,286 | $119,920 |
| 2022 | $4,006 | $119,814 | $5,754 | $114,060 |
| 2021 | $1,426 | $47,438 | $4,273 | $43,165 |
| 2020 | $1,502 | $47,438 | $4,273 | $43,165 |
| 2019 | $1,505 | $47,438 | $4,273 | $43,165 |
| 2018 | $1,446 | $47,438 | $4,273 | $43,165 |
| 2017 | $703 | $49,197 | $4,273 | $44,924 |
| 2016 | -- | $49,197 | $4,273 | $44,924 |
| 2015 | -- | $52,301 | $4,273 | $48,028 |
| 2014 | -- | $52,301 | $4,273 | $48,028 |
| 2013 | -- | $52,300 | $4,272 | $48,028 |
Source: Public Records
Map
Nearby Homes
- 0 Piedmont Rd Unit 10600733
- 270 Cannafax Rd
- 967 Five Points Rd
- 746 Highway 18 W
- 0 Roger Brown Dr Unit 10702547
- 696 Georgia 18
- 178 Barnesville Ave
- 113 Heatherwood Ln
- 109 Barnesville Ave
- 121 Westchester Dr
- 13 Brown St
- 407 Westchester Dr
- 103 Silver Dollar Rd
- 0 Silver Dollar Rd Unit 10552561
- 149 Akins St
- 140 Catalpa Rd
- 135 Catalpa Rd
- 339 Atlanta St
- 0 Wilson Rd Unit 10564610
- 146 Maple Dr
- 283 Old Milner Rd
- 22AC Cannafax Rd Unit 7
- 289 Old Milner Rd
- 263 Old Milner Rd
- 307 Old Milner Rd
- 307 Old Milner Rd
- 313 Old Milner Rd
- 134 Cannafax Rd
- 321 Old Milner Rd
- 339 Old Milner Rd
- 144 Cannafax Rd
- 0 Piedmont Rd Unit 8459797
- 0 Piedmont Rd Unit 7416723
- 0 Piedmont Rd Unit 7487876
- 0 Piedmont Rd Unit 7505656
- 0 Piedmont Rd Unit 7550048
- 0 Piedmont Rd Unit 7573972
- 0 Piedmont Rd Unit 8038890
- 0 Piedmont Rd Unit 20049295
- 0 Piedmont Rd Unit 17 + Acres 8205142
Your Personal Tour Guide
Ask me questions while you tour the home.