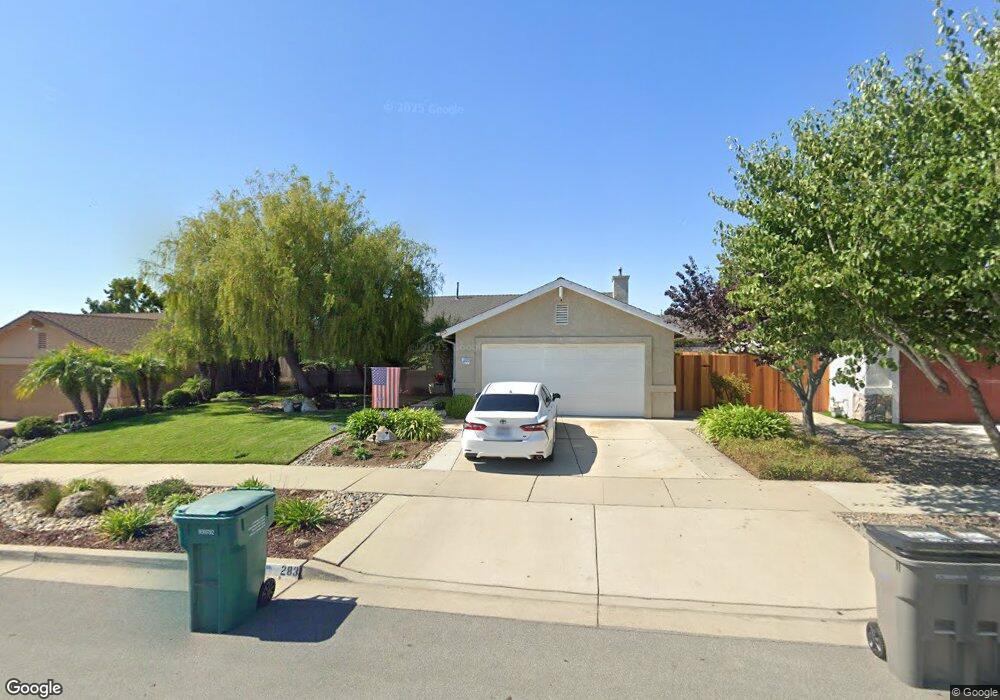
283 Pinecrest Place Nipomo, CA 93444
Estimated Value: $733,000 - $756,158
3
Beds
2
Baths
1,600
Sq Ft
$465/Sq Ft
Est. Value
About This Home
This home is located at 283 Pinecrest Place, Nipomo, CA 93444 and is currently estimated at $743,540, approximately $464 per square foot. 283 Pinecrest Place is a home located in San Luis Obispo County with nearby schools including Dana Elementary School, Mesa Middle School, and Nipomo High School.
Ownership History
Date
Name
Owned For
Owner Type
Purchase Details
Closed on
Oct 2, 2006
Sold by
Demello Scott W and De Mello Nicole D
Bought by
Demello Scott W and Demello Nicole D
Current Estimated Value
Purchase Details
Closed on
Jan 7, 2005
Sold by
Demello Scott W and Demello Nicole D
Bought by
The De Mello Family Trust
Purchase Details
Closed on
Dec 3, 1999
Sold by
Bonita Homes Inc
Bought by
Demello Scott W and Demello Nicole D
Home Financials for this Owner
Home Financials are based on the most recent Mortgage that was taken out on this home.
Original Mortgage
$195,000
Interest Rate
7.03%
Create a Home Valuation Report for This Property
The Home Valuation Report is an in-depth analysis detailing your home's value as well as a comparison with similar homes in the area
Home Values in the Area
Average Home Value in this Area
Purchase History
| Date | Buyer | Sale Price | Title Company |
|---|---|---|---|
| Demello Scott W | -- | None Available | |
| Demello Scott W | -- | None Available | |
| The De Mello Family Trust | -- | -- | |
| Demello Scott W | $265,000 | Cuesta Title Company |
Source: Public Records
Mortgage History
| Date | Status | Borrower | Loan Amount |
|---|---|---|---|
| Previous Owner | Demello Scott W | $195,000 |
Source: Public Records
Tax History Compared to Growth
Tax History
| Year | Tax Paid | Tax Assessment Tax Assessment Total Assessment is a certain percentage of the fair market value that is determined by local assessors to be the total taxable value of land and additions on the property. | Land | Improvement |
|---|---|---|---|---|
| 2025 | $4,034 | $399,293 | $128,073 | $271,220 |
| 2024 | $3,986 | $391,464 | $125,562 | $265,902 |
| 2023 | $3,986 | $383,789 | $123,100 | $260,689 |
| 2022 | $3,924 | $376,265 | $120,687 | $255,578 |
| 2021 | $3,916 | $368,888 | $118,321 | $250,567 |
| 2020 | $3,870 | $365,106 | $117,108 | $247,998 |
| 2019 | $3,845 | $357,948 | $114,812 | $243,136 |
| 2018 | $3,798 | $350,930 | $112,561 | $238,369 |
| 2017 | $3,725 | $344,050 | $110,354 | $233,696 |
| 2016 | $3,512 | $337,305 | $108,191 | $229,114 |
| 2015 | $3,460 | $332,239 | $106,566 | $225,673 |
| 2014 | $3,331 | $325,732 | $104,479 | $221,253 |
Source: Public Records
Map
Nearby Homes
- Mesa Plan at Hill Street Terraces - Hill Street Series
- Pacific Plan at Hill Street Terraces - Hill Street Series
- Monarch Plan at Hill Street Terraces - Hill Street Series
- Rancho Plan at Hill Street Terraces - Hill Street Series
- Dana Plan at Hill Street Terraces - Hill Street Series
- 109 Gardenia Way
- 719 W Tefft St
- 680 Hill St
- 759 Viola Ct
- 483 Violet Ave
- 522 Higos Way
- 368 Avenida de Amigos
- 205 Encino Ln
- 525 Grande Ave Unit D
- 228 Chaparral Ln
- 221 Crosby Way
- 945 Jeanette Ln
- 219 Lema Dr
- 426 Polaris Dr
- 240 Chaparral Ln
- 283 Pinecrest Place Unit LOT
- 279 Pinecrest Place Unit LOT
- 279 Pinecrest Place
- 245 Buckhorn Rd
- 249 Buckhorn Rd
- 275 Pinecrest Place Unit LOT
- 275 Pinecrest Place
- 239 Buckhorn Rd
- 255 Buckhorn Rd
- 282 Pinecrest Place
- 288 Pinecrest Place
- 278 Pinecrest Place
- 235 Buckhorn Rd
- 271 Pinecrest Place Unit LOT
- 274 Pinecrest Place
- 798 Bristlecone Ln