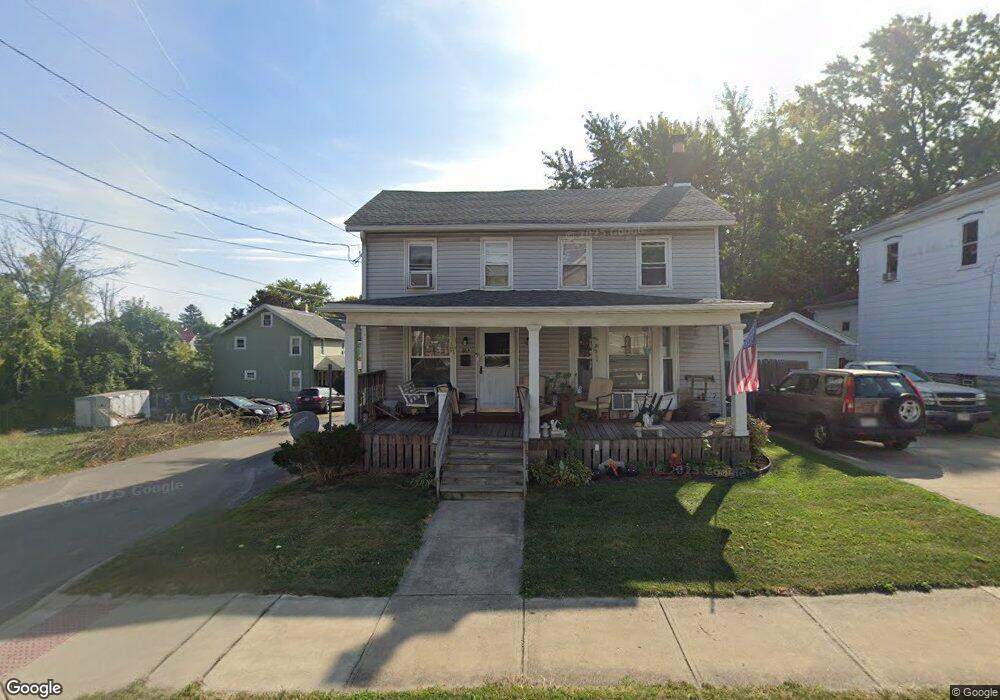
283 S Main St Mansfield, OH 44902
Estimated Value: $60,000 - $70,000
4
Beds
2
Baths
1,349
Sq Ft
$48/Sq Ft
Est. Value
About This Home
This home is located at 283 S Main St, Mansfield, OH 44902 and is currently estimated at $64,686, approximately $47 per square foot. 283 S Main St is a home located in Richland County with nearby schools including St. Peter's Elementary/Montessori School, St. Peter's High School/Junior High, and Discovery School.
Ownership History
Date
Name
Owned For
Owner Type
Purchase Details
Closed on
Aug 12, 2014
Sold by
Thompson Rocky D
Bought by
Phillips Rodney J
Current Estimated Value
Purchase Details
Closed on
Nov 27, 2000
Sold by
Birchfield Laird K
Bought by
Thompson Rocky D
Home Financials for this Owner
Home Financials are based on the most recent Mortgage that was taken out on this home.
Original Mortgage
$54,075
Interest Rate
7.87%
Mortgage Type
New Conventional
Create a Home Valuation Report for This Property
The Home Valuation Report is an in-depth analysis detailing your home's value as well as a comparison with similar homes in the area
Home Values in the Area
Average Home Value in this Area
Purchase History
| Date | Buyer | Sale Price | Title Company |
|---|---|---|---|
| Phillips Rodney J | $5,000 | Chicago Title Agency Of Nort | |
| Thompson Rocky D | $52,500 | -- |
Source: Public Records
Mortgage History
| Date | Status | Borrower | Loan Amount |
|---|---|---|---|
| Previous Owner | Thompson Rocky D | $54,075 |
Source: Public Records
Tax History Compared to Growth
Tax History
| Year | Tax Paid | Tax Assessment Tax Assessment Total Assessment is a certain percentage of the fair market value that is determined by local assessors to be the total taxable value of land and additions on the property. | Land | Improvement |
|---|---|---|---|---|
| 2024 | $122 | $2,540 | $2,010 | $530 |
| 2023 | $122 | $2,540 | $2,010 | $530 |
| 2022 | $136 | $2,380 | $1,940 | $440 |
| 2021 | $137 | $2,380 | $1,940 | $440 |
| 2020 | $140 | $2,380 | $1,940 | $440 |
| 2019 | $132 | $2,030 | $1,650 | $380 |
| 2018 | $131 | $2,030 | $1,650 | $380 |
| 2017 | $127 | $2,030 | $1,650 | $380 |
| 2016 | $113 | $1,750 | $1,340 | $410 |
| 2015 | $617 | $10,000 | $1,680 | $8,320 |
| 2014 | $206 | $10,000 | $1,680 | $8,320 |
| 2012 | $476 | $10,510 | $1,760 | $8,750 |
Source: Public Records
Map
Nearby Homes
- 259 S Main St
- 286 S Main St
- 212 S Main St
- 188 S Franklin Ave
- 327 Hammond Ave
- 319 Altamont Ave
- 186 S Mulberry St
- 137 Lexington Ave
- 175 S Mulberry St
- 96 Glenwood Heights
- 394 S Main St
- 172 -172 1 2 Lexington Ave
- 120 Grover St
- 0 N Adams St
- 353 Sturges Ave
- 0 Cline Ave Hedeen Abbeyfeale Unit 9066362
- 131 Sturges Ave
- 69 Reba Ave
- 116 W 2nd St
- 257 Wood St