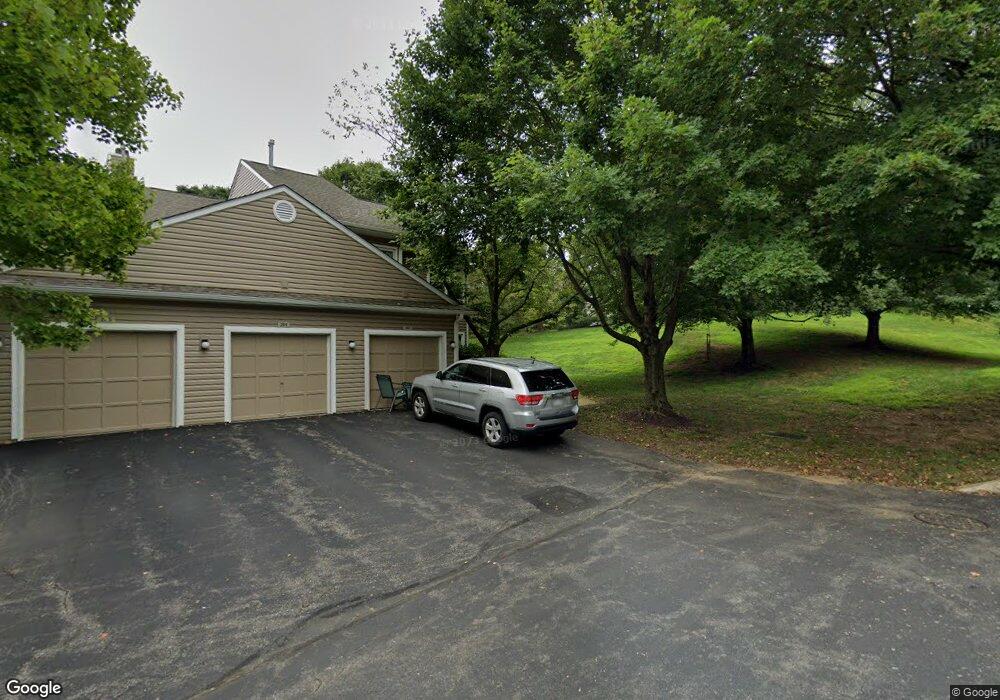
283 Stanton Ct Unit 283 Glen Mills, PA 19342
Estimated Value: $402,000 - $440,000
3
Beds
2
Baths
1,600
Sq Ft
$261/Sq Ft
Est. Value
About This Home
This home is located at 283 Stanton Ct Unit 283, Glen Mills, PA 19342 and is currently estimated at $417,171, approximately $260 per square foot. 283 Stanton Ct Unit 283 is a home located in Delaware County with nearby schools including Garnet Valley High School and St. Thomas Apostle School.
Ownership History
Date
Name
Owned For
Owner Type
Purchase Details
Closed on
Jun 30, 2022
Sold by
Corradetti Alieen M
Bought by
Rutherford Patrick and Rutherford Ellen
Current Estimated Value
Home Financials for this Owner
Home Financials are based on the most recent Mortgage that was taken out on this home.
Original Mortgage
$240,000
Outstanding Balance
$201,364
Interest Rate
4.31%
Mortgage Type
New Conventional
Estimated Equity
$215,807
Purchase Details
Closed on
Jul 28, 2019
Sold by
Purner William M
Bought by
Purner William M and Corradetti Alieen M
Purchase Details
Closed on
Aug 13, 1998
Sold by
Basher Helen Anne
Bought by
Purner William M and Blair Kathleen M
Home Financials for this Owner
Home Financials are based on the most recent Mortgage that was taken out on this home.
Original Mortgage
$102,900
Interest Rate
6.86%
Create a Home Valuation Report for This Property
The Home Valuation Report is an in-depth analysis detailing your home's value as well as a comparison with similar homes in the area
Home Values in the Area
Average Home Value in this Area
Purchase History
| Date | Buyer | Sale Price | Title Company |
|---|---|---|---|
| Rutherford Patrick | $300,000 | Global Title | |
| Purner William M | -- | None Available | |
| Purner William M | $147,000 | Commonwealth Land Title Ins |
Source: Public Records
Mortgage History
| Date | Status | Borrower | Loan Amount |
|---|---|---|---|
| Open | Rutherford Patrick | $240,000 | |
| Previous Owner | Purner William M | $102,900 |
Source: Public Records
Tax History Compared to Growth
Tax History
| Year | Tax Paid | Tax Assessment Tax Assessment Total Assessment is a certain percentage of the fair market value that is determined by local assessors to be the total taxable value of land and additions on the property. | Land | Improvement |
|---|---|---|---|---|
| 2025 | $5,317 | $234,150 | $68,820 | $165,330 |
| 2024 | $5,317 | $234,150 | $68,820 | $165,330 |
| 2023 | $5,190 | $234,150 | $68,820 | $165,330 |
| 2022 | $5,109 | $234,150 | $68,820 | $165,330 |
| 2021 | $8,612 | $234,150 | $68,820 | $165,330 |
| 2020 | $5,184 | $131,640 | $38,400 | $93,240 |
| 2019 | $5,111 | $131,640 | $38,400 | $93,240 |
| 2018 | $5,046 | $131,640 | $0 | $0 |
| 2017 | $4,948 | $131,640 | $0 | $0 |
| 2016 | $737 | $131,640 | $0 | $0 |
| 2015 | $737 | $131,640 | $0 | $0 |
| 2014 | $722 | $131,640 | $0 | $0 |
Source: Public Records
Map
Nearby Homes
- 274 Stanton Ct Unit 274
- 325 Danbury Ct Unit 325
- 90 Bayberry Ct Unit 90
- 83 Bayberry Ct Unit 83
- 20 Highland Dr
- 6107 Lydia Hollow Dr Unit 6107
- 2202 Lydia Hollow Dr Unit A1
- 21 Dougherty Blvd Unit V1
- 36 Eagle Ln Unit 18
- 244 Baltimore Pike Unit 101
- 244 Baltimore Pike Unit 108
- 244 Baltimore Pike Unit 111
- 76 Dogwood Ln
- 11 Ivy Ln
- 9 Ivy Ln
- 277 W Baltimore Pike
- 65 Pole Cat Rd
- 116 Ivy Mills Rd
- 11 Helluva Hill Ln
- 160 Stoney Bank Rd
- 285 Stanton Ct Unit 285
- 286 Stanton Ct Unit 286
- 287 Stanton Ct Unit 287
- 288 Stanton Ct Unit 288
- 282 Stanton Ct Unit 282
- 281 Stanton Ct
- 280 Stanton Ct Unit 280
- 279 Stanton Ct Unit 279
- 278 Stanton Ct Unit 278
- 312 Stanton Ct
- 277 Stanton Ct Unit 277
- 252 Windsor Ct Unit 252
- 251 Windsor Ct
- 250 Windsor Ct Unit 250
- 249 Windsor Ct
- 248 Windsor Ct Unit 248
- 247 Windsor Ct Unit 247
- 246 Windsor Ct Unit 246
- 245 Windsor Ct Unit 245
- 299 Stanton Ct Unit 299