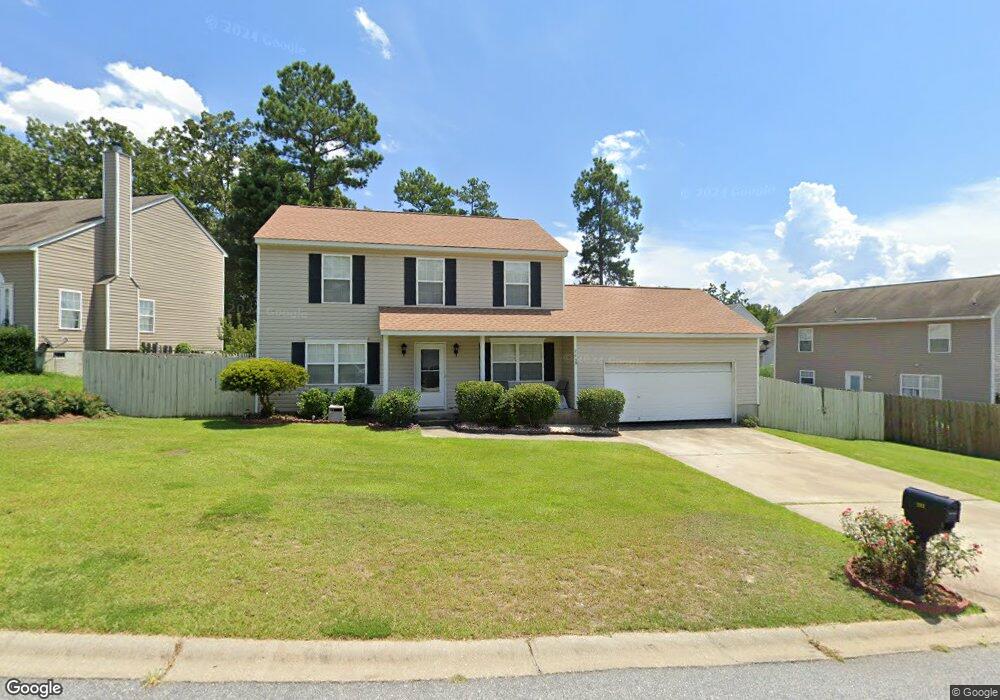
283 Walkbridge Way Chapin, SC 29036
Estimated Value: $190,000 - $265,000
3
Beds
3
Baths
1,664
Sq Ft
$142/Sq Ft
Est. Value
About This Home
This home is located at 283 Walkbridge Way, Chapin, SC 29036 and is currently estimated at $236,028, approximately $141 per square foot. 283 Walkbridge Way is a home located in Lexington County with nearby schools including Chapin Elementary School, Chapin Intermediate, and Chapin High School.
Ownership History
Date
Name
Owned For
Owner Type
Purchase Details
Closed on
Apr 30, 2010
Sold by
Allison Timothy Scott and Seltmannjr Ronald B
Bought by
Martin Viola
Current Estimated Value
Home Financials for this Owner
Home Financials are based on the most recent Mortgage that was taken out on this home.
Original Mortgage
$131,632
Outstanding Balance
$87,751
Interest Rate
4.94%
Mortgage Type
Future Advance Clause Open End Mortgage
Estimated Equity
$148,277
Purchase Details
Closed on
Oct 9, 2007
Sold by
Nvr Rymarc Homes Of South Carolina Llc
Bought by
Seltmann Ronald B
Home Financials for this Owner
Home Financials are based on the most recent Mortgage that was taken out on this home.
Original Mortgage
$112,504
Interest Rate
6.41%
Mortgage Type
Purchase Money Mortgage
Purchase Details
Closed on
Jul 6, 2007
Sold by
Five Star Development Llc
Bought by
Nvr Mortgage Homes Of South Carolina Llc
Create a Home Valuation Report for This Property
The Home Valuation Report is an in-depth analysis detailing your home's value as well as a comparison with similar homes in the area
Home Values in the Area
Average Home Value in this Area
Purchase History
| Date | Buyer | Sale Price | Title Company |
|---|---|---|---|
| Martin Viola | $129,000 | -- | |
| Seltmann Ronald B | $125,005 | None Available | |
| Nvr Mortgage Homes Of South Carolina Llc | $20,500 | None Available |
Source: Public Records
Mortgage History
| Date | Status | Borrower | Loan Amount |
|---|---|---|---|
| Open | Martin Viola | $131,632 | |
| Previous Owner | Seltmann Ronald B | $112,504 |
Source: Public Records
Tax History
| Year | Tax Paid | Tax Assessment Tax Assessment Total Assessment is a certain percentage of the fair market value that is determined by local assessors to be the total taxable value of land and additions on the property. | Land | Improvement |
|---|---|---|---|---|
| 2024 | $488 | $5,199 | $866 | $4,333 |
| 2023 | $404 | $5,199 | $866 | $4,333 |
| 2020 | $841 | $5,199 | $866 | $4,333 |
| 2019 | $743 | $4,521 | $800 | $3,721 |
| 2018 | $654 | $4,521 | $800 | $3,721 |
| 2017 | $637 | $4,521 | $800 | $3,721 |
| 2016 | $653 | $4,521 | $800 | $3,721 |
| 2014 | $743 | $5,159 | $800 | $4,359 |
| 2013 | -- | $5,160 | $800 | $4,360 |
Source: Public Records
Map
Nearby Homes
- 106 Shipyard Blvd
- 141 Palm St
- 0 Dreher Island Rd Unit 21647709
- 0 Dreher Island Rd Unit 587193
- 180 Palm St
- 192 Palm St
- 190 Elm Creek Dr
- 171 Elm Creek Dr
- 409 Dutchman Shores Cir
- 392 Eagle Pointe Dr
- 188 Kerry Gibbons Dr
- 160 State Road S-32-716
- 125 Northshore Dr
- 147 Ventnor Ave
- 151 Ventnor Ave
- 108 Pennsylvania Ct
- 814 Dutchmaster Dr
- 820 Dutchmaster Dr
- 0 Mainsail Ln Unit 622256
- 1168 Old Bush River Rd
- 275 Walkbridge Way
- 121 Walkbridge Way
- 127 Walkbridge Way
- 133 Walkbridge Way
- 271 Walkbridge Way
- 139 Walkbridge Way
- 107 Walkbridge Way
- 284 Walkbridge Way
- 280 Walkbridge Way
- 267 Walkbridge Way
- 276 Walkbridge Way
- 145 Walkbridge Way
- 272 Walkbridge Way
- 9 Walkbridge Ct
- 122 Walkbridge Way
- 126 Walkbridge Way
- 118 Walkbridge Way
- 268 Walkbridge Way
- 130 Walkbridge Way
- 114 Walkbridge Way
Your Personal Tour Guide
Ask me questions while you tour the home.