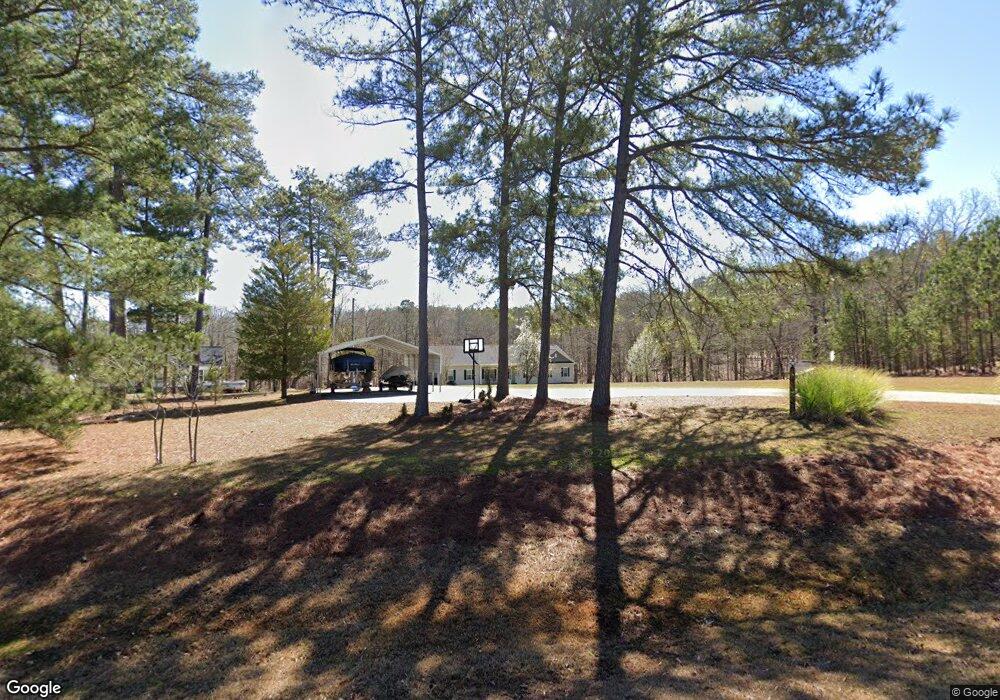
2830 Maxim Rd Lincolnton, GA 30817
Estimated Value: $471,000 - $638,000
3
Beds
2
Baths
2,010
Sq Ft
$272/Sq Ft
Est. Value
About This Home
This home is located at 2830 Maxim Rd, Lincolnton, GA 30817 and is currently estimated at $546,957, approximately $272 per square foot. 2830 Maxim Rd is a home with nearby schools including Lincoln County Elementary School, Lincoln County Middle School, and Lincoln County High School.
Ownership History
Date
Name
Owned For
Owner Type
Purchase Details
Closed on
Jul 5, 2005
Sold by
Franken James E
Bought by
Tyler Larry F and Tyler Kathy Anne
Current Estimated Value
Purchase Details
Closed on
Apr 28, 2005
Sold by
Tyler Larry F
Bought by
Tyler Kathy Anne
Home Financials for this Owner
Home Financials are based on the most recent Mortgage that was taken out on this home.
Original Mortgage
$120,000
Interest Rate
5.98%
Mortgage Type
New Conventional
Purchase Details
Closed on
Nov 12, 2004
Sold by
Franken Mary and Franken James E
Bought by
Franken James E
Purchase Details
Closed on
Sep 18, 1998
Sold by
Carr Howard and Dutch Ann
Bought by
Franken Mary and Franken James E
Purchase Details
Closed on
Oct 20, 1994
Sold by
Fulmer Donald R
Bought by
Carr Howard and Dutch Ann
Purchase Details
Closed on
Apr 25, 1991
Sold by
Hall William L and Hall Claire C
Bought by
Fulmer Donald R
Purchase Details
Closed on
May 24, 1976
Sold by
Clifford Wilma L
Bought by
Hall William L and Hall Claire C
Create a Home Valuation Report for This Property
The Home Valuation Report is an in-depth analysis detailing your home's value as well as a comparison with similar homes in the area
Home Values in the Area
Average Home Value in this Area
Purchase History
| Date | Buyer | Sale Price | Title Company |
|---|---|---|---|
| Tyler Larry F | -- | -- | |
| Tyler Kathy Anne | -- | -- | |
| Tyler Larry F | $150,000 | -- | |
| Franken James E | -- | -- | |
| Franken Mary | $125,000 | -- | |
| Carr Howard | $45,000 | -- | |
| Fulmer Donald R | $23,000 | -- | |
| Hall William L | -- | -- |
Source: Public Records
Mortgage History
| Date | Status | Borrower | Loan Amount |
|---|---|---|---|
| Previous Owner | Tyler Larry F | $120,000 |
Source: Public Records
Tax History Compared to Growth
Tax History
| Year | Tax Paid | Tax Assessment Tax Assessment Total Assessment is a certain percentage of the fair market value that is determined by local assessors to be the total taxable value of land and additions on the property. | Land | Improvement |
|---|---|---|---|---|
| 2024 | $3,978 | $160,000 | $31,920 | $128,080 |
| 2023 | $3,585 | $136,320 | $31,920 | $104,400 |
| 2022 | $3,331 | $132,720 | $31,920 | $100,800 |
| 2021 | $3,451 | $125,080 | $31,920 | $93,160 |
| 2020 | $2,905 | $91,320 | $31,920 | $59,400 |
| 2019 | $2,915 | $91,320 | $31,920 | $59,400 |
| 2018 | $2,870 | $91,320 | $31,920 | $59,400 |
| 2017 | $2,987 | $95,032 | $31,920 | $63,112 |
| 2016 | $2,917 | $95,032 | $31,920 | $63,112 |
| 2015 | -- | $95,032 | $31,920 | $63,112 |
| 2014 | -- | $95,032 | $31,920 | $63,112 |
| 2013 | -- | $95,032 | $31,920 | $63,112 |
Source: Public Records
Map
Nearby Homes
- 1129 Lakeside Dr
- 1179 Lakeside Dr
- 1016 Hidden Lake Ct
- 1018 Serenity Pointe Dr
- 1164 Sally Ann Ct
- 1158 Sally Ann Ct
- 1008 Serenity Pointe Dr
- 1032 Serenity Pointe Dr
- 1085 Lake Dr
- 1051 Lake Dr
- 1080 Serenity Pointe Dr
- 1063 Fleming Lake Ct
- 1063 Fleming Lk Ct
- 1036 Longleaf Way
- 0 Sturkey Ferry Rd Unit 24022341
- 1060 Longleaf Way
- 1128 Whitstone Rd
- 1131 Whitstone Rd
- 1094 Longleaf Way
- 1106 Longleaf Way