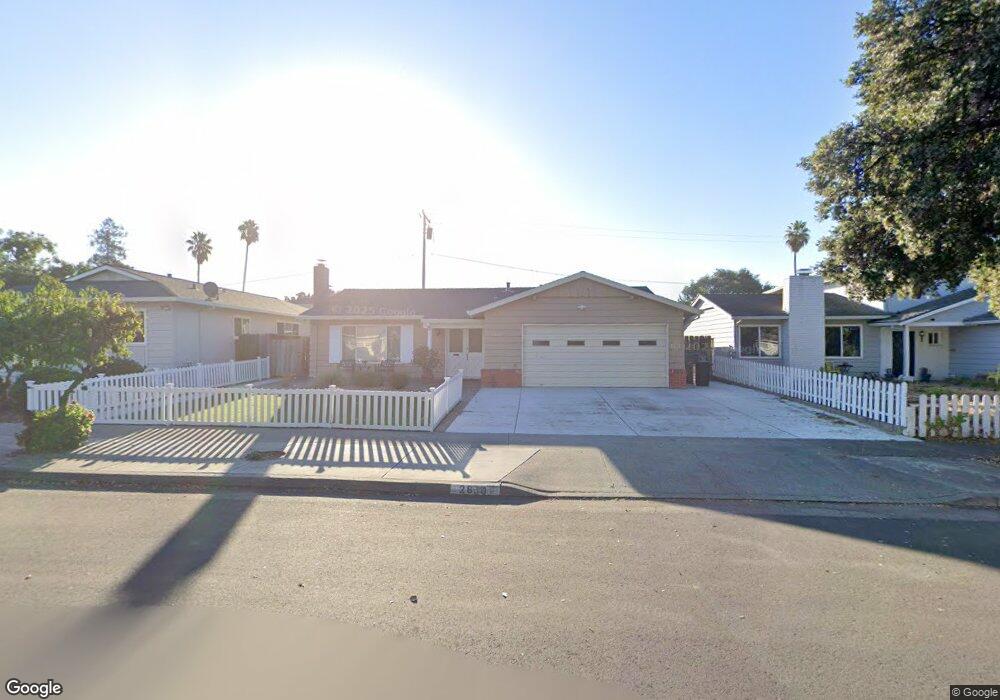
2830 Monte Cresta Way San Jose, CA 95132
Cherrywood NeighborhoodEstimated Value: $611,000 - $1,554,098
4
Beds
2
Baths
1,477
Sq Ft
$882/Sq Ft
Est. Value
About This Home
This home is located at 2830 Monte Cresta Way, San Jose, CA 95132 and is currently estimated at $1,302,775, approximately $882 per square foot. 2830 Monte Cresta Way is a home located in Santa Clara County with nearby schools including Cherrywood Elementary School, Sierramont Middle School, and Independence High School.
Ownership History
Date
Name
Owned For
Owner Type
Purchase Details
Closed on
Dec 30, 2019
Sold by
Le La Tho
Bought by
Le La Tho and Tho Le La Revocable Trust
Current Estimated Value
Purchase Details
Closed on
Aug 22, 2019
Sold by
Lin David and Le La Tho
Bought by
Le La Tho
Purchase Details
Closed on
Dec 22, 2009
Sold by
Lin David and La Tho Le
Bought by
Lin David and La Tho Le
Purchase Details
Closed on
Feb 23, 2001
Sold by
Latho Le
Bought by
Latho Le and Lin David
Purchase Details
Closed on
Oct 12, 2000
Sold by
Lale Oanh T
Bought by
Latho Le
Purchase Details
Closed on
Dec 22, 1998
Sold by
Le Duc Huu
Bought by
Lale Oanh
Home Financials for this Owner
Home Financials are based on the most recent Mortgage that was taken out on this home.
Original Mortgage
$200,000
Interest Rate
6.82%
Purchase Details
Closed on
Jan 7, 1996
Sold by
Le Duc H
Bought by
Lale Oanh
Create a Home Valuation Report for This Property
The Home Valuation Report is an in-depth analysis detailing your home's value as well as a comparison with similar homes in the area
Home Values in the Area
Average Home Value in this Area
Purchase History
| Date | Buyer | Sale Price | Title Company |
|---|---|---|---|
| Le La Tho | -- | None Available | |
| Le La Tho | -- | None Available | |
| Lin David | -- | None Available | |
| Lin David | -- | None Available | |
| Latho Le | -- | -- | |
| Latho Le | -- | -- | |
| Lale Oanh | -- | American Title Co | |
| Lale Oanh | -- | Fidelity National Title Ins |
Source: Public Records
Mortgage History
| Date | Status | Borrower | Loan Amount |
|---|---|---|---|
| Closed | Lale Oanh | $200,000 |
Source: Public Records
Tax History Compared to Growth
Tax History
| Year | Tax Paid | Tax Assessment Tax Assessment Total Assessment is a certain percentage of the fair market value that is determined by local assessors to be the total taxable value of land and additions on the property. | Land | Improvement |
|---|---|---|---|---|
| 2025 | $8,127 | $538,384 | $215,352 | $323,032 |
| 2024 | $8,127 | $527,829 | $211,130 | $316,699 |
| 2023 | $7,966 | $517,481 | $206,991 | $310,490 |
| 2022 | $8,018 | $507,335 | $202,933 | $304,402 |
| 2021 | $7,747 | $497,388 | $198,954 | $298,434 |
| 2020 | $7,410 | $492,288 | $196,914 | $295,374 |
| 2019 | $7,126 | $482,636 | $193,053 | $289,583 |
| 2018 | $7,018 | $473,173 | $189,268 | $283,905 |
| 2017 | $7,049 | $463,896 | $185,557 | $278,339 |
| 2016 | $6,754 | $454,801 | $181,919 | $272,882 |
| 2015 | $6,671 | $447,971 | $179,187 | $268,784 |
| 2014 | $6,043 | $439,196 | $175,677 | $263,519 |
Source: Public Records
Map
Nearby Homes
- 2790 Longford Dr
- 1373 Ferrel Ct
- 2966 Crater Ln
- 1756 Valhalla Ct
- 2616 Sierra Village Ct
- 1199 Morrill Ave
- 1693 Peachwood Dr
- 2520 Amaryl Dr
- 2280 Zoria Cir
- 2210 Renfrew Ct
- 3093 Melchester Dr
- 3190 Vesuvius Ln
- 3092 Halgrim Ct
- 2314 Oak Flat Rd
- 1599 Clampett Way
- 3070 Ironside Ct
- 1898 Anne Marie Ct
- 1690 Coraltree Place
- 2844 Parkrow Ln
- 2064 Wizard Ct
- 2832 Monte Cresta Way
- 2828 Monte Cresta Way
- 2821 Camino Del Rey
- 2819 Camino Del Rey
- 2834 Monte Cresta Way
- 2826 Monte Cresta Way Unit 99
- 2823 Camino Del Rey
- 2817 Camino Del Rey
- 2831 Monte Cresta Way
- 2829 Monte Cresta Way
- 2829 Camino Del Rey
- 2838 Monte Cresta Way
- 2833 Monte Cresta Way
- 2824 Monte Cresta Way
- 2827 Monte Cresta Way
- 2813 Camino Del Rey
- 2835 Monte Cresta Way
- 2833 Camino Del Rey
- 2840 Monte Cresta Way
- 2822 Monte Cresta Way