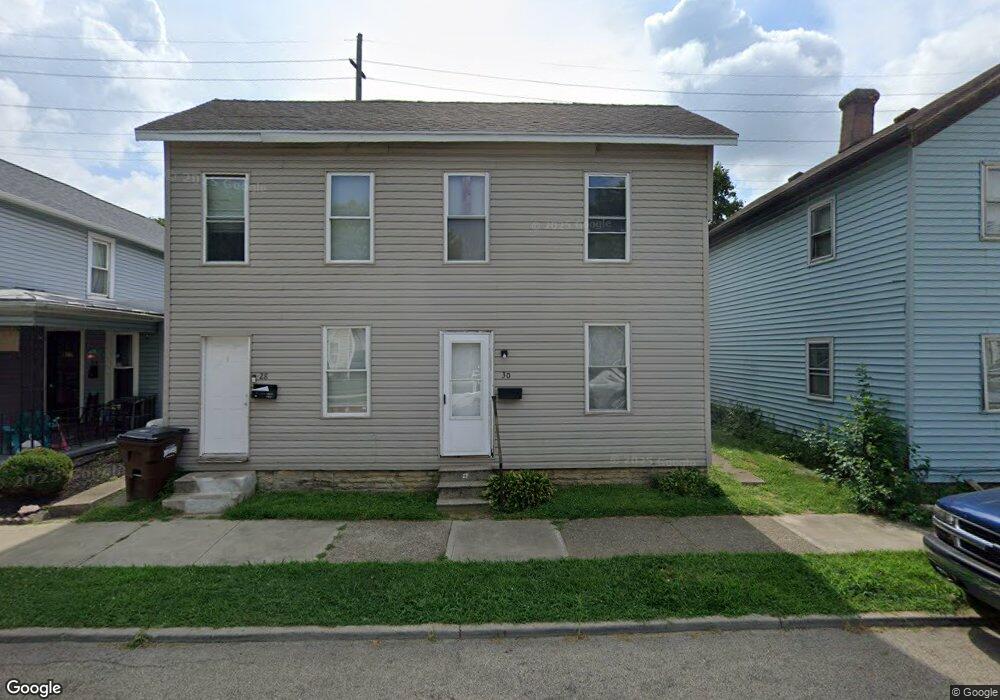
2830 S Main St Franklin, OH 45005
Estimated Value: $106,000 - $177,000
2
Beds
2
Baths
2,260
Sq Ft
$61/Sq Ft
Est. Value
About This Home
This home is located at 2830 S Main St, Franklin, OH 45005 and is currently estimated at $137,464, approximately $60 per square foot. 2830 S Main St is a home with nearby schools including Franklin High School.
Ownership History
Date
Name
Owned For
Owner Type
Purchase Details
Closed on
Dec 31, 2003
Sold by
Dyas Mark A and Dorsey William Roscoe
Bought by
Dorsey Dyas Family Real Estate Holdings
Current Estimated Value
Purchase Details
Closed on
Aug 6, 1990
Sold by
Dinus Dinus and Dinus James Jeffrey
Bought by
Ralph Dorsey and Ralph Wm.
Purchase Details
Closed on
Aug 19, 1983
Sold by
Dinus Dinus and Dinus James Jeffrey
Bought by
Dinus Dinus and Dinus James Jeffrey
Purchase Details
Closed on
Mar 25, 1983
Sold by
Barlion Ruth and Barlion Ruth
Bought by
Dinus and James Jeffrey
Create a Home Valuation Report for This Property
The Home Valuation Report is an in-depth analysis detailing your home's value as well as a comparison with similar homes in the area
Home Values in the Area
Average Home Value in this Area
Purchase History
| Date | Buyer | Sale Price | Title Company |
|---|---|---|---|
| Dorsey Dyas Family Real Estate Holdings | -- | -- | |
| Ralph Dorsey | $37,600 | -- | |
| Dinus Dinus | -- | -- | |
| Dinus | $10,500 | -- |
Source: Public Records
Tax History
| Year | Tax Paid | Tax Assessment Tax Assessment Total Assessment is a certain percentage of the fair market value that is determined by local assessors to be the total taxable value of land and additions on the property. | Land | Improvement |
|---|---|---|---|---|
| 2025 | $1,129 | $23,450 | $4,310 | $19,140 |
| 2024 | $1,129 | $23,450 | $4,310 | $19,140 |
| 2023 | $966 | $18,011 | $2,439 | $15,571 |
| 2022 | $947 | $18,011 | $2,440 | $15,572 |
| 2021 | $897 | $18,011 | $2,440 | $15,572 |
| 2020 | $808 | $14,294 | $1,936 | $12,359 |
| 2019 | $736 | $14,294 | $1,936 | $12,359 |
| 2018 | $726 | $14,294 | $1,936 | $12,359 |
| 2017 | $749 | $13,293 | $1,862 | $11,431 |
| 2016 | $764 | $13,293 | $1,862 | $11,431 |
| 2015 | $764 | $13,293 | $1,862 | $11,431 |
| 2014 | $783 | $13,290 | $1,860 | $11,430 |
| 2013 | $667 | $15,370 | $2,150 | $13,220 |
Source: Public Records
Map
Nearby Homes
- 5 S River St
- 202 E 2nd St
- 45 W 3rd St
- 205 Oxford Rd
- 0 E 4th St
- 309 Oxford Rd
- 0 Victoria Dr Unit 942075
- 0 Victoria Dr Unit 1852824
- 228 Bridge St
- 11 Highridge Ct
- 410 Park Ave
- 551 E 2nd St
- 1512 Knightsbridge Ct
- 527 S Main St
- 21 Skokiaan Dr
- 509 Forest Ave
- 533 Spring Ave
- 627 S River St
- 511 Forest Ave
- 705 S Main St
Your Personal Tour Guide
Ask me questions while you tour the home.