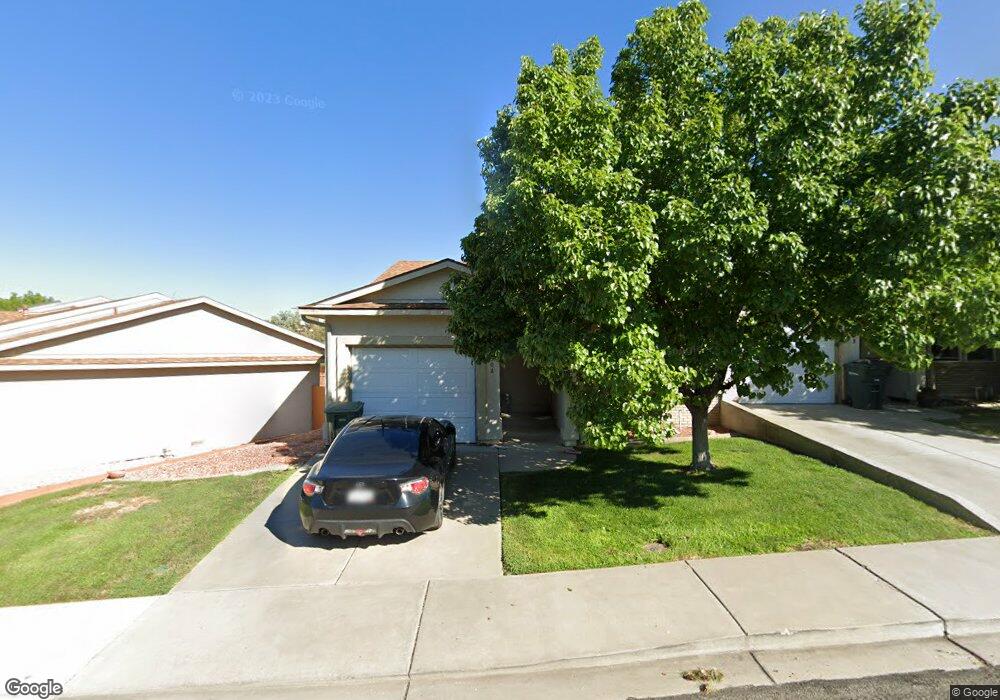
2830 Villa Way Unit A Grand Junction, CO 81501
Downtown Grand Junction NeighborhoodEstimated Value: $323,000 - $339,000
2
Beds
2
Baths
1,304
Sq Ft
$252/Sq Ft
Est. Value
About This Home
This home is located at 2830 Villa Way Unit A, Grand Junction, CO 81501 and is currently estimated at $328,412, approximately $251 per square foot. 2830 Villa Way Unit A is a home located in Mesa County with nearby schools including Nisley Elementary School, Bookcliff Middle School, and Central High School.
Ownership History
Date
Name
Owned For
Owner Type
Purchase Details
Closed on
May 28, 2002
Sold by
Steadman Ruby Jane
Bought by
Mynar Linda P
Current Estimated Value
Home Financials for this Owner
Home Financials are based on the most recent Mortgage that was taken out on this home.
Original Mortgage
$121,125
Outstanding Balance
$51,612
Interest Rate
6.92%
Estimated Equity
$276,800
Purchase Details
Closed on
Apr 9, 2002
Sold by
Durham Sondra Lynn
Bought by
Steadman Ruby Jane
Home Financials for this Owner
Home Financials are based on the most recent Mortgage that was taken out on this home.
Original Mortgage
$121,125
Outstanding Balance
$51,612
Interest Rate
6.92%
Estimated Equity
$276,800
Purchase Details
Closed on
Mar 2, 1999
Sold by
Steadman Ruby J
Bought by
Durham Sondra L
Purchase Details
Closed on
Jul 18, 1995
Sold by
Dorssey Robert L
Bought by
Mynar Linda P
Purchase Details
Closed on
Mar 29, 1995
Sold by
Sarver Tony
Bought by
Mynar Linda P
Purchase Details
Closed on
Jun 1, 1994
Sold by
Sarver Tony
Bought by
Mynar Linda P
Create a Home Valuation Report for This Property
The Home Valuation Report is an in-depth analysis detailing your home's value as well as a comparison with similar homes in the area
Home Values in the Area
Average Home Value in this Area
Purchase History
| Date | Buyer | Sale Price | Title Company |
|---|---|---|---|
| Mynar Linda P | $127,500 | -- | |
| Steadman Ruby Jane | -- | -- | |
| Durham Sondra L | -- | -- | |
| Mynar Linda P | $94,500 | -- | |
| Mynar Linda P | $24,000 | -- | |
| Mynar Linda P | $100,000 | -- |
Source: Public Records
Mortgage History
| Date | Status | Borrower | Loan Amount |
|---|---|---|---|
| Open | Mynar Linda P | $121,125 |
Source: Public Records
Tax History Compared to Growth
Tax History
| Year | Tax Paid | Tax Assessment Tax Assessment Total Assessment is a certain percentage of the fair market value that is determined by local assessors to be the total taxable value of land and additions on the property. | Land | Improvement |
|---|---|---|---|---|
| 2024 | $548 | $14,640 | $3,480 | $11,160 |
| 2023 | $548 | $14,640 | $3,480 | $11,160 |
| 2022 | $523 | $14,410 | $3,130 | $11,280 |
| 2021 | $525 | $14,820 | $3,220 | $11,600 |
| 2020 | $425 | $12,710 | $2,500 | $10,210 |
| 2019 | $402 | $12,710 | $2,500 | $10,210 |
| 2018 | $384 | $11,070 | $2,160 | $8,910 |
| 2017 | $690 | $11,070 | $2,160 | $8,910 |
| 2016 | $690 | $11,210 | $1,990 | $9,220 |
| 2015 | $700 | $11,210 | $1,990 | $9,220 |
| 2014 | $663 | $10,680 | $1,990 | $8,690 |
Source: Public Records
Map
Nearby Homes
- 2836 Grand Falls Cir Unit A
- 586 28 1 2 Rd
- 2809 Day Break Ave
- 554 Princess St
- TBD 28 1 4 Rd
- 575 28 1 4 Rd Unit 2
- 2866 Presley Ave
- 553 Princess St
- 596 Sinatra Way
- 2525 Pheasant Run Cir
- 567 Cagney Ct
- 581 W Indian Creek Dr Unit 2,4,5,6
- 2534 Bookcliff Ave
- 2450 Pheasant Trail Ct
- 543 1/2 Wasatch St
- 2813 Columbine Park Ct
- 569 Graff Dairy Ct
- 536 1/2 Normandy Way
- 536 Normandy Way
- 2305 Springside Ct
- 2830 Villa Way Unit C
- 2830 Villa Way Unit B
- 2828 Villa Way Unit C
- 2828 Villa Way Unit B
- 2828 Villa Way Unit A
- 2835 Villa Way Unit 6
- 2835 Villa Way Unit 5
- 2835 Villa Way Unit 4
- 2835 Villa Way Unit 3
- 2835 Villa Way Unit 8
- 2835 Villa Way Unit 2
- 2835 Villa Way Unit 1
- 2835 Villa Way
- 2835 Villa Way
- 2832 Grand Falls Cir Unit C
- 2832 Grand Falls Cir Unit B
- 2832 Grand Falls Cir Unit A
- 2835 Grand Falls Cir Unit 9
- 2835 Grand Falls Cir Unit 8