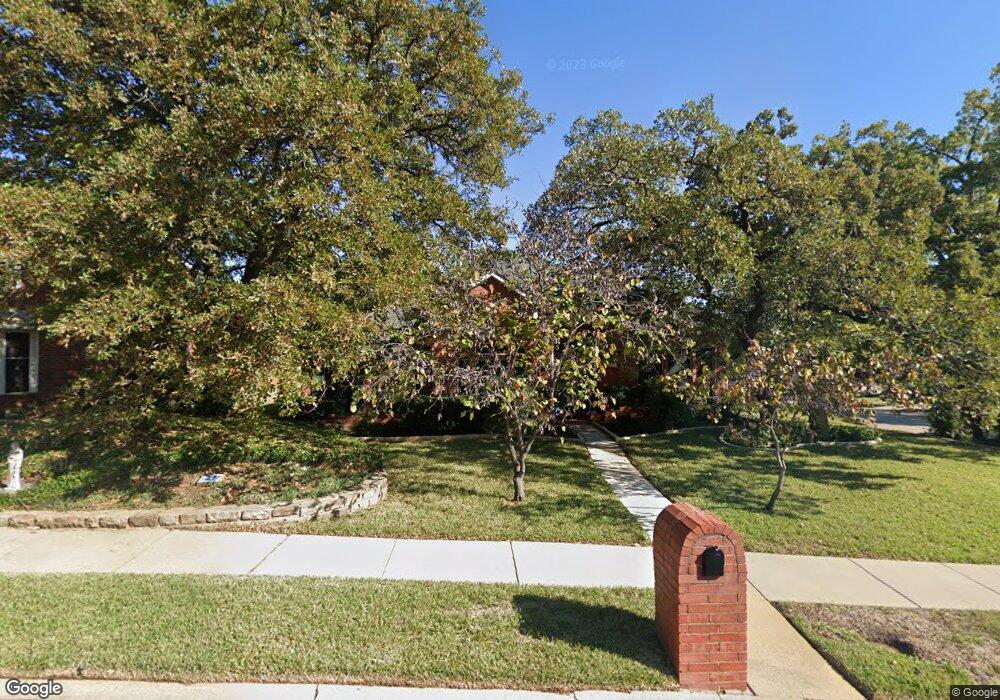
2831 Southridge Dr Denton, TX 76210
South Denton NeighborhoodEstimated Value: $402,371 - $434,000
--
Bed
3
Baths
2,366
Sq Ft
$179/Sq Ft
Est. Value
About This Home
This home is located at 2831 Southridge Dr, Denton, TX 76210 and is currently estimated at $422,343, approximately $178 per square foot. 2831 Southridge Dr is a home located in Denton County with nearby schools including Houston Elementary School, McMath Middle School, and Denton High School.
Ownership History
Date
Name
Owned For
Owner Type
Purchase Details
Closed on
Feb 20, 2002
Sold by
Ladbrook Warren D and Ladbrook Colette S
Bought by
Stark Terry Mann and Stark Aileene
Current Estimated Value
Home Financials for this Owner
Home Financials are based on the most recent Mortgage that was taken out on this home.
Original Mortgage
$120,000
Interest Rate
6.81%
Purchase Details
Closed on
Sep 30, 1999
Sold by
Smith Roman R and Smith Ruth L
Bought by
Ladbrook Warren D and Ladbrook Colette S
Home Financials for this Owner
Home Financials are based on the most recent Mortgage that was taken out on this home.
Original Mortgage
$166,725
Interest Rate
7.83%
Purchase Details
Closed on
Aug 30, 1996
Sold by
Beazer Homes Texas Lp
Bought by
Smith Roman R
Home Financials for this Owner
Home Financials are based on the most recent Mortgage that was taken out on this home.
Original Mortgage
$125,600
Interest Rate
8.24%
Create a Home Valuation Report for This Property
The Home Valuation Report is an in-depth analysis detailing your home's value as well as a comparison with similar homes in the area
Home Values in the Area
Average Home Value in this Area
Purchase History
| Date | Buyer | Sale Price | Title Company |
|---|---|---|---|
| Stark Terry Mann | -- | -- | |
| Ladbrook Warren D | -- | -- | |
| Smith Roman R | -- | -- |
Source: Public Records
Mortgage History
| Date | Status | Borrower | Loan Amount |
|---|---|---|---|
| Previous Owner | Stark Terry Mann | $120,000 | |
| Previous Owner | Ladbrook Warren D | $166,725 | |
| Previous Owner | Smith Roman R | $125,600 |
Source: Public Records
Tax History Compared to Growth
Tax History
| Year | Tax Paid | Tax Assessment Tax Assessment Total Assessment is a certain percentage of the fair market value that is determined by local assessors to be the total taxable value of land and additions on the property. | Land | Improvement |
|---|---|---|---|---|
| 2025 | -- | $394,921 | $106,438 | $288,483 |
| 2024 | $7,367 | $381,671 | $0 | $0 |
| 2023 | $6,625 | $346,974 | $106,438 | $308,138 |
| 2022 | $6,696 | $315,431 | $106,438 | $243,344 |
| 2021 | $6,375 | $286,755 | $72,572 | $214,183 |
| 2020 | $6,613 | $289,336 | $72,572 | $216,764 |
| 2019 | $6,620 | $277,454 | $72,572 | $216,692 |
| 2018 | $6,093 | $252,231 | $63,459 | $188,772 |
| 2017 | $6,082 | $246,045 | $52,883 | $193,162 |
| 2016 | $5,545 | $224,327 | $42,306 | $186,898 |
| 2015 | -- | $203,934 | $42,306 | $161,628 |
| 2013 | -- | $193,255 | $37,018 | $156,237 |
Source: Public Records
Map
Nearby Homes
- 2501 Great Bear Ln
- 2544 Natchez Trace
- 2312 Caddo Cir
- 2272 Hollyhill Ln
- 2009 Lake Fork Ct
- 2253 Hollyhill Ln
- 2409 Loon Lake Rd
- 2209 Loon Lake Rd
- 2000 Lamprey Cir
- 2505 Pioneer Dr
- 2508 Pioneer Dr
- 2600 Pioneer Dr
- 720 Smokerise Cir
- 916 Smokerise Cir
- 3432 Sundown Blvd
- 924 Ridgecrest Cir
- 1108 Ellison Park Cir
- 1012 Indian Ridge Dr
- 2218 Southridge Dr
- 209 Pennsylvania Dr
- 2827 Southridge Dr
- 2604 Shiloh Rd
- 2608 Shiloh Rd
- 2312 Shenandoah Trail
- 2828 Southridge Dr
- 2823 Southridge Dr
- 2824 Southridge Dr
- 2308 Shenandoah Trail
- 2320 Shenandoah Trail
- 2516 Shiloh Rd
- 2304 Shenandoah Trail
- 2512 Shiloh Rd
- 2324 Shenandoah Trail
- 2300 Shenandoah Trail
- 2401 Shenandoah Trail
- 2549 Natchez Trace
- 2400 Potomac Pkwy
- 2820 Southridge Dr
- 2645 Charleston Ct
- 2641 Charleston Ct