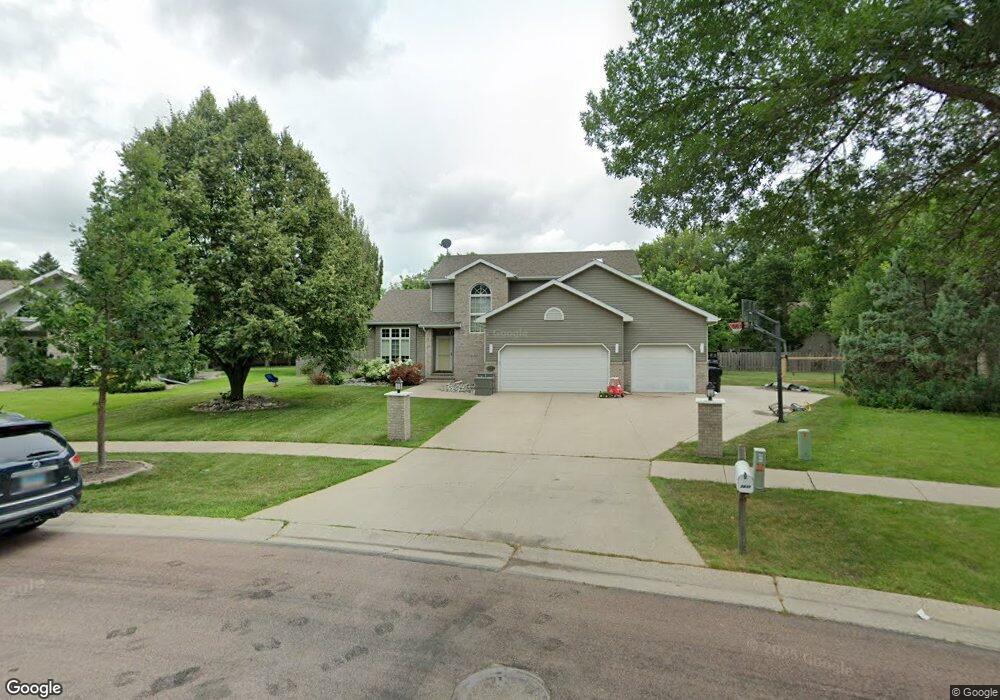
2832 39 1/2 Ave S Fargo, ND 58104
Stonebridge NeighborhoodEstimated Value: $496,000 - $539,419
5
Beds
4
Baths
3,830
Sq Ft
$135/Sq Ft
Est. Value
About This Home
This home is located at 2832 39 1/2 Ave S, Fargo, ND 58104 and is currently estimated at $516,105, approximately $134 per square foot. 2832 39 1/2 Ave S is a home located in Cass County with nearby schools including Centennial Elementary School, Discovery Middle School, and Fargo Davies High School.
Ownership History
Date
Name
Owned For
Owner Type
Purchase Details
Closed on
Jul 23, 2018
Sold by
Ripley Holly B and Ripley Gregg W
Bought by
Jones Anthony and Jones Jenna
Current Estimated Value
Home Financials for this Owner
Home Financials are based on the most recent Mortgage that was taken out on this home.
Original Mortgage
$318,400
Outstanding Balance
$271,168
Interest Rate
3.75%
Mortgage Type
Adjustable Rate Mortgage/ARM
Estimated Equity
$244,937
Purchase Details
Closed on
May 20, 2013
Sold by
Finch Richard M and Finch Lori J
Bought by
Ripley Holly B and Ripley Gregg W
Home Financials for this Owner
Home Financials are based on the most recent Mortgage that was taken out on this home.
Original Mortgage
$315,153
Interest Rate
3.52%
Mortgage Type
New Conventional
Purchase Details
Closed on
Sep 12, 2011
Sold by
Herter Jason D and Herter Laura L
Bought by
Finch Richard M and Finch Lori J
Home Financials for this Owner
Home Financials are based on the most recent Mortgage that was taken out on this home.
Original Mortgage
$235,200
Interest Rate
4.59%
Mortgage Type
New Conventional
Purchase Details
Closed on
Sep 19, 2008
Sold by
Grindberg Tony S and Grindberg Karen A
Bought by
Herter Jason D and Herter Laura L
Home Financials for this Owner
Home Financials are based on the most recent Mortgage that was taken out on this home.
Original Mortgage
$236,000
Interest Rate
6.55%
Mortgage Type
New Conventional
Create a Home Valuation Report for This Property
The Home Valuation Report is an in-depth analysis detailing your home's value as well as a comparison with similar homes in the area
Home Values in the Area
Average Home Value in this Area
Purchase History
| Date | Buyer | Sale Price | Title Company |
|---|---|---|---|
| Jones Anthony | $398,000 | Regency Title | |
| Ripley Holly B | $324,900 | U S Title Fargo | |
| Finch Richard M | $294,000 | -- | |
| Herter Jason D | -- | -- |
Source: Public Records
Mortgage History
| Date | Status | Borrower | Loan Amount |
|---|---|---|---|
| Open | Jones Anthony | $318,400 | |
| Previous Owner | Ripley Holly B | $315,153 | |
| Previous Owner | Finch Richard M | $235,200 | |
| Previous Owner | Herter Jason D | $236,000 |
Source: Public Records
Tax History Compared to Growth
Tax History
| Year | Tax Paid | Tax Assessment Tax Assessment Total Assessment is a certain percentage of the fair market value that is determined by local assessors to be the total taxable value of land and additions on the property. | Land | Improvement |
|---|---|---|---|---|
| 2024 | $6,647 | $252,900 | $55,650 | $197,250 |
| 2023 | $6,640 | $236,350 | $55,650 | $180,700 |
| 2022 | $6,162 | $214,900 | $61,900 | $153,000 |
| 2021 | $5,705 | $200,850 | $61,900 | $138,950 |
| 2020 | $5,673 | $200,850 | $61,900 | $138,950 |
| 2019 | $5,380 | $189,500 | $38,700 | $150,800 |
| 2018 | $5,300 | $189,500 | $38,700 | $150,800 |
| 2017 | $5,255 | $189,500 | $38,700 | $150,800 |
| 2016 | $4,887 | $192,000 | $38,700 | $153,300 |
| 2015 | $4,596 | $174,550 | $26,300 | $148,250 |
| 2014 | $4,300 | $158,700 | $26,300 | $132,400 |
| 2013 | $4,312 | $154,100 | $26,300 | $127,800 |
Source: Public Records
Map
Nearby Homes
- 2832 39 1 2 Ave S
- 2824 39 1 2 Ave S
- 2824 39 1/2 Ave S
- 2840 39 1/2 Ave S
- 2905 40th Ave S
- 2817 39 1 2 Ave S
- 2817 39 1/2 Ave S
- 2816 39 1/2 Ave S
- 2843 39th Ave S
- 2816 39th Ave S
- 2808 39 1 2 Ave S
- 2809 39 1 2 Ave S
- 2809 39 1/2 Ave S
- 2808 39 1/2 Ave S
- 2915 40th Ave S
- 2833 39th Ave S
- 4003 Copperfield Ct S
- 2833 39 1/2 Ave S
- 2808 39th Ave S
- 2808 39th Ave S