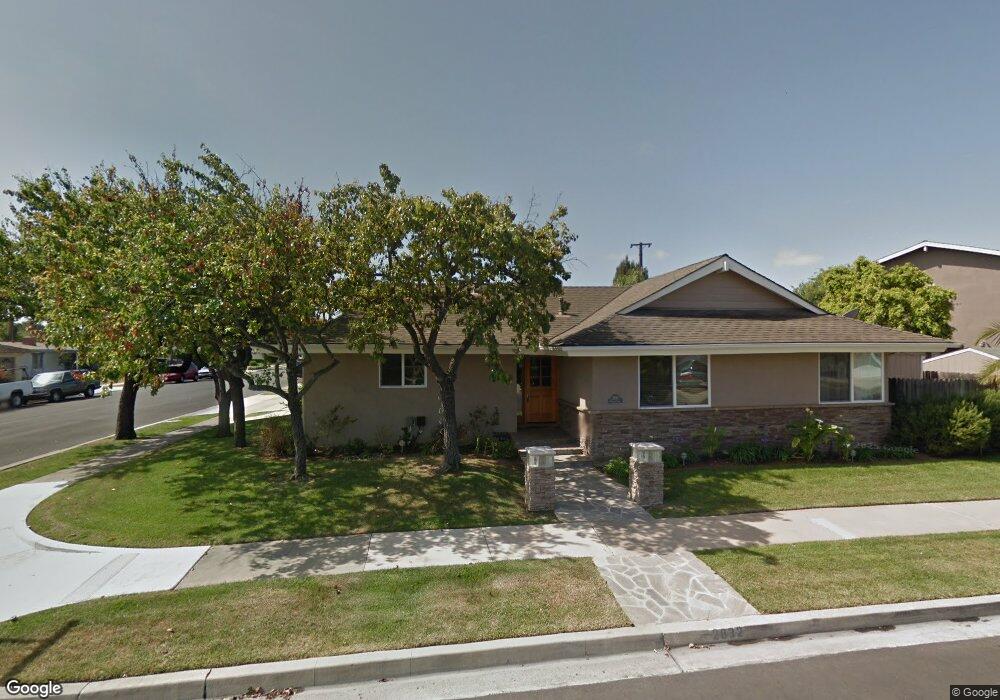
2832 Francis Ln Costa Mesa, CA 92626
Estimated Value: $1,316,281 - $1,485,000
3
Beds
2
Baths
1,272
Sq Ft
$1,088/Sq Ft
Est. Value
About This Home
This home is located at 2832 Francis Ln, Costa Mesa, CA 92626 and is currently estimated at $1,383,820, approximately $1,087 per square foot. 2832 Francis Ln is a home located in Orange County with nearby schools including Sonora Elementary School, Costa Mesa High School, and St. John the Baptist Catholic School.
Ownership History
Date
Name
Owned For
Owner Type
Purchase Details
Closed on
Dec 27, 2023
Sold by
Hancock Kip and Hancock Janet L
Bought by
Hancock Family Trust and Hancock
Current Estimated Value
Purchase Details
Closed on
Jun 27, 2017
Sold by
Hancock Kip and Hancock Kip
Bought by
Hancock Kip and Hancock Janet L
Home Financials for this Owner
Home Financials are based on the most recent Mortgage that was taken out on this home.
Original Mortgage
$430,200
Interest Rate
3.89%
Mortgage Type
New Conventional
Purchase Details
Closed on
Jul 18, 1997
Sold by
Prickett John W and Prickett Nancy S
Bought by
Hancock Kip W
Home Financials for this Owner
Home Financials are based on the most recent Mortgage that was taken out on this home.
Original Mortgage
$172,000
Interest Rate
7.43%
Create a Home Valuation Report for This Property
The Home Valuation Report is an in-depth analysis detailing your home's value as well as a comparison with similar homes in the area
Purchase History
| Date | Buyer | Sale Price | Title Company |
|---|---|---|---|
| Hancock Family Trust | -- | Accommodation/Courtesy Recordi | |
| Hancock Kip | -- | Fidelity National Title Oran | |
| Hancock Kip W | $215,000 | First American Title Ins Co |
Source: Public Records
Mortgage History
| Date | Status | Borrower | Loan Amount |
|---|---|---|---|
| Previous Owner | Hancock Kip | $430,200 | |
| Previous Owner | Hancock Kip W | $172,000 | |
| Closed | Hancock Kip W | $21,500 |
Source: Public Records
Tax History
| Year | Tax Paid | Tax Assessment Tax Assessment Total Assessment is a certain percentage of the fair market value that is determined by local assessors to be the total taxable value of land and additions on the property. | Land | Improvement |
|---|---|---|---|---|
| 2025 | $4,479 | $343,290 | $235,474 | $107,816 |
| 2024 | $4,479 | $336,559 | $230,857 | $105,702 |
| 2023 | $4,303 | $329,960 | $226,330 | $103,630 |
| 2022 | $4,120 | $323,491 | $221,892 | $101,599 |
| 2021 | $3,976 | $317,149 | $217,542 | $99,607 |
| 2020 | $3,923 | $313,898 | $215,312 | $98,586 |
| 2019 | $3,838 | $307,744 | $211,091 | $96,653 |
| 2018 | $3,760 | $301,710 | $206,952 | $94,758 |
| 2017 | $3,699 | $295,795 | $202,895 | $92,900 |
| 2016 | $3,623 | $289,996 | $198,917 | $91,079 |
| 2015 | $3,586 | $285,640 | $195,929 | $89,711 |
| 2014 | $3,507 | $280,045 | $192,091 | $87,954 |
Source: Public Records
Map
Nearby Homes
- 895 Sonora Rd
- 825 Sonora Rd
- 2836 Portola Dr
- 832 Presidio Dr
- 913 Junipero Dr
- 2702 San Lucas Ln
- 970 Valencia St
- 944 Tesla Ln
- 1030 Palmetto Way
- 1016 Valencia St
- 810 Baker St Unit 112
- 781 Grayling Bay
- 783 Grayling
- 917 Helena Cir
- 3012 Garfield Ave
- 3032 Grant Ave
- 952 Cheyenne St
- 2682 Pala Mesa Ct
- 2691 Club Mesa Place
- 135 Del Mar Ave
- 2826 Francis Ln
- 2819 Loreto Ave
- 2822 Francis Ln
- 2830 Loreto Ave
- 2826 Loreto Ave
- 2822 Loreto Ave
- 2815 Loreto Ave
- 2833 Francis Ln
- 2831 Francis Ln
- 2829 Francis Ln
- 2827 Francis Ln
- 2834 Loreto Ave
- 2811 Loreto Ave
- 2823 Francis Ln
- 2814 Loreto Ave
- 2825 Portola Dr
- 2821 Portola Dr
- 839 Sonora Rd
- 2827 Portola Dr
- 843 Sonora Rd
Your Personal Tour Guide
Ask me questions while you tour the home.