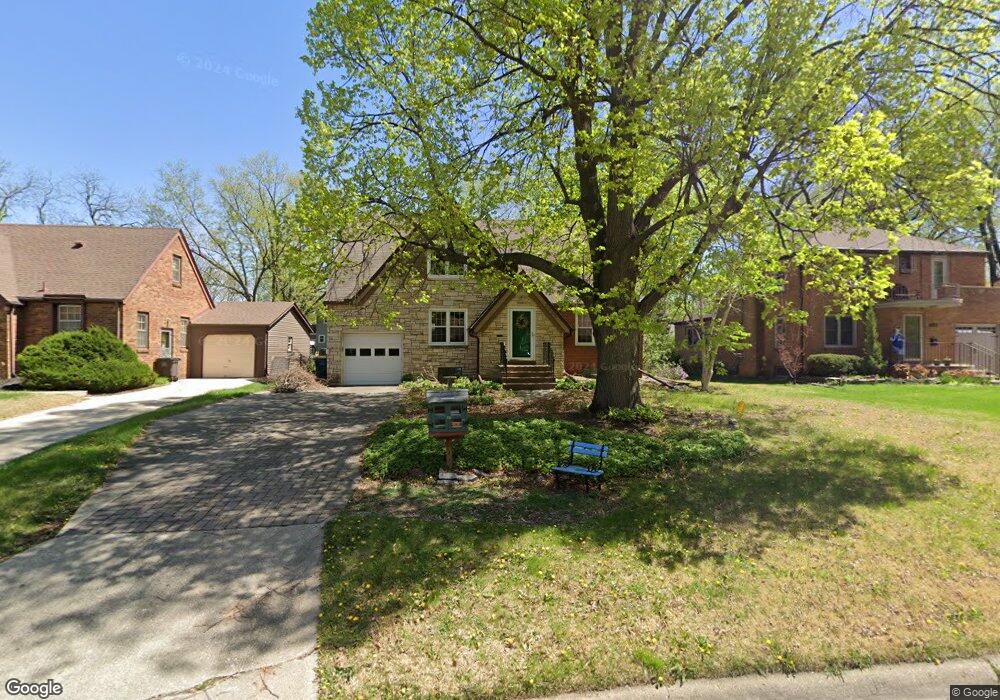
2835 46th St Des Moines, IA 50310
Beaverdale NeighborhoodEstimated Value: $323,000 - $372,000
4
Beds
2
Baths
1,708
Sq Ft
$201/Sq Ft
Est. Value
About This Home
This home is located at 2835 46th St, Des Moines, IA 50310 and is currently estimated at $342,526, approximately $200 per square foot. 2835 46th St is a home located in Polk County with nearby schools including Hillis Elementary School, Meredith Middle School, and Hoover High School.
Ownership History
Date
Name
Owned For
Owner Type
Purchase Details
Closed on
Sep 24, 2025
Sold by
Linda D Appelgate Revocable Trust and Appelgate Linda D
Bought by
Linda Appelgate Family Trust and Appelgate
Current Estimated Value
Purchase Details
Closed on
Mar 9, 2016
Sold by
Northwest Beaver Development Llc
Bought by
Donovan Development Llc
Purchase Details
Closed on
May 17, 2012
Sold by
Appelgate Linda D
Bought by
Appelgate Linda D and Linda D Appelgate Revocable Tr
Purchase Details
Closed on
Mar 15, 2004
Sold by
Zmolek Jeremy and Zmolek Tiffany
Bought by
Appelgate Linda
Home Financials for this Owner
Home Financials are based on the most recent Mortgage that was taken out on this home.
Original Mortgage
$90,000
Interest Rate
5.06%
Mortgage Type
Purchase Money Mortgage
Purchase Details
Closed on
Dec 6, 2001
Sold by
Munro Patrick T and Munro Mary Kay
Bought by
Zmolek Jeremy and Zmolek Tiffany
Home Financials for this Owner
Home Financials are based on the most recent Mortgage that was taken out on this home.
Original Mortgage
$148,402
Interest Rate
6.68%
Create a Home Valuation Report for This Property
The Home Valuation Report is an in-depth analysis detailing your home's value as well as a comparison with similar homes in the area
Home Values in the Area
Average Home Value in this Area
Purchase History
| Date | Buyer | Sale Price | Title Company |
|---|---|---|---|
| Linda Appelgate Family Trust | -- | None Listed On Document | |
| Donovan Development Llc | -- | None Available | |
| Appelgate Linda D | -- | None Available | |
| Appelgate Linda | $169,500 | -- | |
| Zmolek Jeremy | $161,000 | -- |
Source: Public Records
Mortgage History
| Date | Status | Borrower | Loan Amount |
|---|---|---|---|
| Previous Owner | Appelgate Linda | $90,000 | |
| Previous Owner | Zmolek Jeremy | $148,402 |
Source: Public Records
Tax History
| Year | Tax Paid | Tax Assessment Tax Assessment Total Assessment is a certain percentage of the fair market value that is determined by local assessors to be the total taxable value of land and additions on the property. | Land | Improvement |
|---|---|---|---|---|
| 2025 | $5,602 | $329,900 | $53,800 | $276,100 |
| 2024 | $5,602 | $302,200 | $48,300 | $253,900 |
| 2023 | $5,920 | $302,200 | $48,300 | $253,900 |
| 2022 | $5,874 | $260,100 | $42,700 | $217,400 |
| 2021 | $5,738 | $260,100 | $42,700 | $217,400 |
| 2020 | $5,954 | $238,500 | $39,100 | $199,400 |
| 2019 | $5,624 | $238,500 | $39,100 | $199,400 |
| 2018 | $5,562 | $217,800 | $34,800 | $183,000 |
| 2017 | $4,994 | $217,800 | $34,800 | $183,000 |
| 2016 | $4,862 | $193,200 | $30,500 | $162,700 |
| 2015 | $4,862 | $193,200 | $30,500 | $162,700 |
| 2014 | $4,480 | $177,300 | $27,400 | $149,900 |
Source: Public Records
Map
Nearby Homes
Your Personal Tour Guide
Ask me questions while you tour the home.