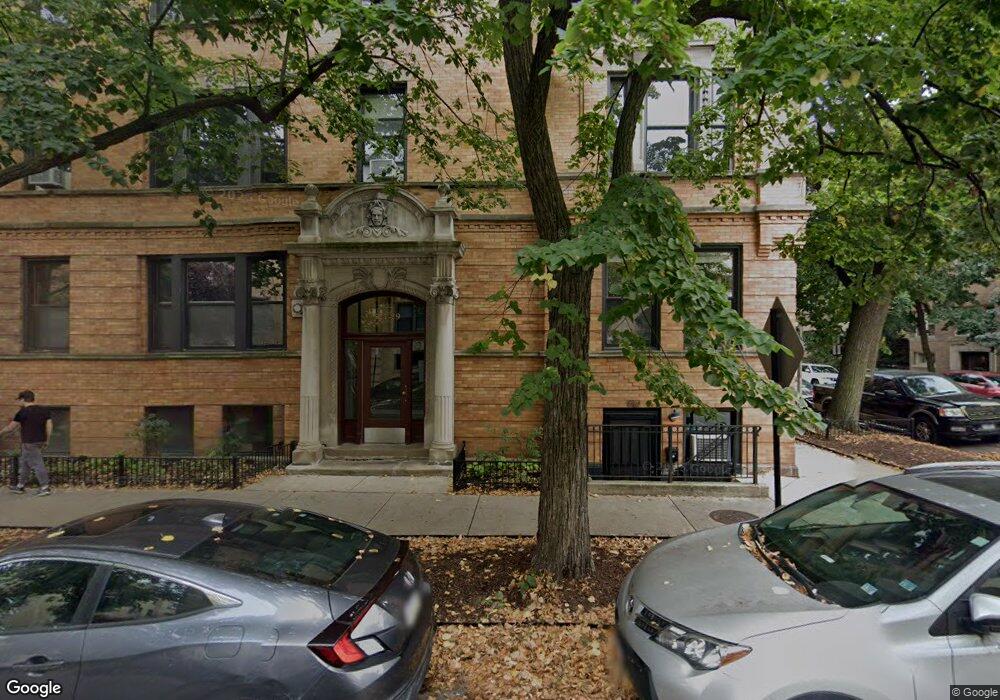
2835 N Cambridge Ave Unit 2835 Chicago, IL 60657
Lakeview East NeighborhoodEstimated Value: $398,000 - $547,000
2
Beds
1
Bath
--
Sq Ft
0.38
Acres
About This Home
This home is located at 2835 N Cambridge Ave Unit 2835, Chicago, IL 60657 and is currently estimated at $447,764. 2835 N Cambridge Ave Unit 2835 is a home located in Cook County with nearby schools including Nettelhorst Elementary School, Lake View High School, and Saint Clement School.
Ownership History
Date
Name
Owned For
Owner Type
Purchase Details
Closed on
Mar 9, 2010
Sold by
Valinoti Lila Elizabeth
Bought by
Cooper Anne
Current Estimated Value
Home Financials for this Owner
Home Financials are based on the most recent Mortgage that was taken out on this home.
Original Mortgage
$264,600
Outstanding Balance
$175,809
Interest Rate
5.03%
Mortgage Type
New Conventional
Estimated Equity
$271,955
Purchase Details
Closed on
Jul 8, 2005
Sold by
Valinoti Lila Elizabeth
Bought by
Valinoti Lila Elizabeth and Lila Elizabeth Valinoti Trust
Purchase Details
Closed on
Jul 17, 2002
Sold by
Hart Iris Ferosie and Ferosie Iris G
Bought by
Valinoti Lila E
Home Financials for this Owner
Home Financials are based on the most recent Mortgage that was taken out on this home.
Original Mortgage
$218,000
Interest Rate
6.62%
Create a Home Valuation Report for This Property
The Home Valuation Report is an in-depth analysis detailing your home's value as well as a comparison with similar homes in the area
Home Values in the Area
Average Home Value in this Area
Purchase History
| Date | Buyer | Sale Price | Title Company |
|---|---|---|---|
| Cooper Anne | $294,000 | First American Title Ins Co | |
| Valinoti Lila Elizabeth | -- | -- | |
| Valinoti Lila E | $299,000 | Lawyers Title Ins Corp |
Source: Public Records
Mortgage History
| Date | Status | Borrower | Loan Amount |
|---|---|---|---|
| Open | Cooper Anne | $264,600 | |
| Previous Owner | Valinoti Lila E | $218,000 |
Source: Public Records
Tax History Compared to Growth
Tax History
| Year | Tax Paid | Tax Assessment Tax Assessment Total Assessment is a certain percentage of the fair market value that is determined by local assessors to be the total taxable value of land and additions on the property. | Land | Improvement |
|---|---|---|---|---|
| 2024 | $6,662 | $36,268 | $7,947 | $28,321 |
| 2023 | $6,473 | $34,891 | $6,409 | $28,482 |
| 2022 | $6,473 | $34,891 | $6,409 | $28,482 |
| 2021 | $6,346 | $34,890 | $6,409 | $28,481 |
| 2020 | $6,146 | $30,690 | $4,230 | $26,460 |
| 2019 | $6,067 | $33,627 | $4,230 | $29,397 |
| 2018 | $5,964 | $33,627 | $4,230 | $29,397 |
| 2017 | $5,417 | $28,538 | $3,717 | $24,821 |
| 2016 | $5,216 | $28,538 | $3,717 | $24,821 |
| 2015 | $4,749 | $28,538 | $3,717 | $24,821 |
| 2014 | $4,125 | $24,802 | $3,044 | $21,758 |
| 2013 | $4,033 | $24,802 | $3,044 | $21,758 |
Source: Public Records
Map
Nearby Homes
- 527 W Surf St Unit 2
- 2800 N Pine Grove Ave Unit 8A
- 550 W Surf St Unit 115
- 550 W Surf St Unit 316
- 559 W Surf St Unit 205
- 435 W Surf St Unit 4A
- 2773 N Hampden Ct Unit PH03
- 2754 N Hampden Ct Unit 1706
- 2754 N Hampden Ct Unit 1407
- 2754 N Hampden Ct Unit 1003
- 415 W Surf St
- 2946 N Pine Grove Ave Unit 1S
- 2717 N Lehmann Ct Unit 16
- 2740 N Pine Grove Ave Unit 3D
- 2740 N Pine Grove Ave Unit 13C
- 431 W Oakdale Ave Unit 14C
- 431 W Oakdale Ave Unit 11A
- 431 W Oakdale Ave Unit 10D
- 2930 N Sheridan Rd Unit 2111
- 2727 N Hampden Ct
- 2835 N Cambridge Ave Unit 9
- 2835 N Cambridge Ave Unit 2835
- 2835 N Cambridge Ave Unit 11
- 2835 N Cambridge Ave Unit 6
- 2835 N Cambridge Ave Unit 4
- 2835 N Cambridge Ave Unit 3
- 2835 N Cambridge Ave Unit 2
- 2835 N Cambridge Ave Unit 5213
- 2835 N Cambridge Ave Unit 5273
- 2835 N Cambridge Ave Unit 2835
- 2835 N Cambridge Ave Unit 2835
- 2835 N Cambridge Ave Unit 5231
- 2835 N Cambridge Ave Unit 5191
- 2835 N Cambridge Ave Unit 5271
- 2835 N Cambridge Ave Unit 5232
- 2835 N Cambridge Ave Unit 5211
- 2835 N Cambridge Ave Unit 10
- 2835 N Cambridge Ave Unit 5253
- 2835 N Cambridge Ave Unit 5233
- 2835 N Cambridge Ave Unit 5193