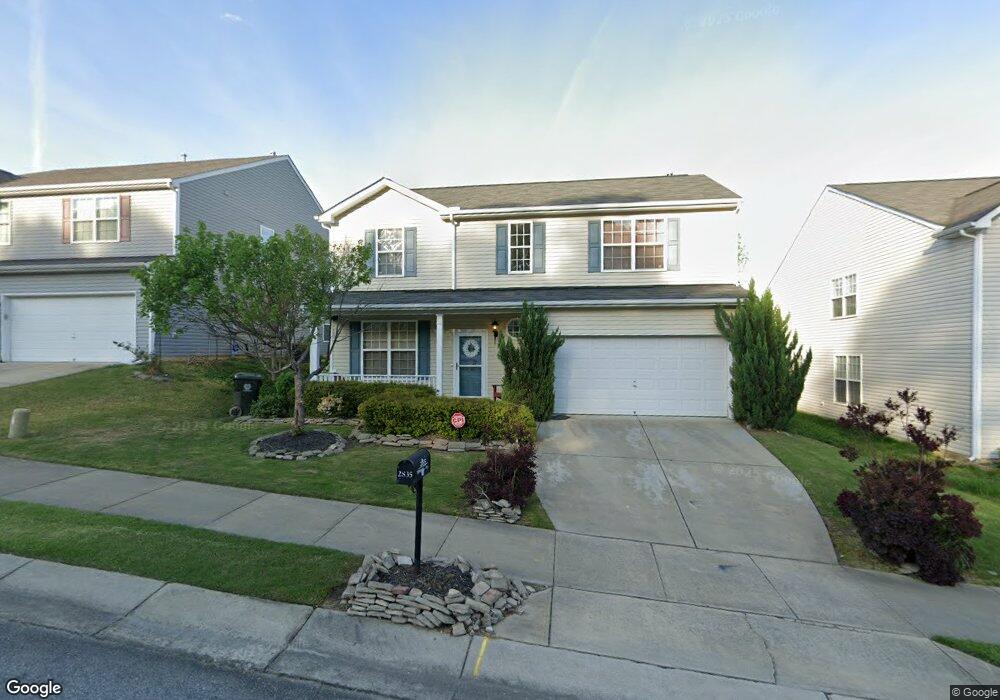
2835 Orchard Trace Way Raleigh, NC 27610
Estimated Value: $322,000 - $332,000
3
Beds
3
Baths
1,783
Sq Ft
$183/Sq Ft
Est. Value
About This Home
This home is located at 2835 Orchard Trace Way, Raleigh, NC 27610 and is currently estimated at $326,349, approximately $183 per square foot. 2835 Orchard Trace Way is a home located in Wake County with nearby schools including Walnut Creek Elementary School, West Lake Middle, and Southeast Raleigh Magnet High School.
Ownership History
Date
Name
Owned For
Owner Type
Purchase Details
Closed on
Aug 21, 2020
Sold by
Tang Virginia
Bought by
Galdamez Alexander A and Navarro Karen Colindres
Current Estimated Value
Home Financials for this Owner
Home Financials are based on the most recent Mortgage that was taken out on this home.
Original Mortgage
$208,550
Outstanding Balance
$184,999
Interest Rate
3%
Mortgage Type
New Conventional
Estimated Equity
$141,351
Purchase Details
Closed on
Aug 3, 2016
Sold by
Tang Virginia and Sennet Earnest
Bought by
Tang Virginia
Home Financials for this Owner
Home Financials are based on the most recent Mortgage that was taken out on this home.
Original Mortgage
$122,960
Interest Rate
3.45%
Mortgage Type
New Conventional
Purchase Details
Closed on
May 4, 2005
Sold by
Beazer Homes Corp
Bought by
Sennet Earnest and Sennet Virginia
Home Financials for this Owner
Home Financials are based on the most recent Mortgage that was taken out on this home.
Original Mortgage
$150,990
Interest Rate
5.99%
Mortgage Type
FHA
Purchase Details
Closed on
Jan 5, 2005
Sold by
Dutchman Subdivision Inc
Bought by
Beazer Homes Corp
Create a Home Valuation Report for This Property
The Home Valuation Report is an in-depth analysis detailing your home's value as well as a comparison with similar homes in the area
Home Values in the Area
Average Home Value in this Area
Purchase History
| Date | Buyer | Sale Price | Title Company |
|---|---|---|---|
| Galdamez Alexander A | $215,000 | None Available | |
| Tang Virginia | -- | First American Title Ins Co | |
| Sennet Earnest | $152,500 | -- | |
| Beazer Homes Corp | $116,000 | -- |
Source: Public Records
Mortgage History
| Date | Status | Borrower | Loan Amount |
|---|---|---|---|
| Open | Galdamez Alexander A | $208,550 | |
| Previous Owner | Tang Virginia | $122,960 | |
| Previous Owner | Sennet Earnest | $150,990 |
Source: Public Records
Tax History Compared to Growth
Tax History
| Year | Tax Paid | Tax Assessment Tax Assessment Total Assessment is a certain percentage of the fair market value that is determined by local assessors to be the total taxable value of land and additions on the property. | Land | Improvement |
|---|---|---|---|---|
| 2025 | $2,761 | $314,310 | $65,000 | $249,310 |
| 2024 | $2,750 | $314,310 | $65,000 | $249,310 |
| 2023 | $1,969 | $178,790 | $34,000 | $144,790 |
| 2022 | $1,830 | $178,790 | $34,000 | $144,790 |
| 2021 | $1,760 | $178,790 | $34,000 | $144,790 |
| 2020 | $1,728 | $178,790 | $34,000 | $144,790 |
| 2019 | $1,731 | $147,614 | $28,000 | $119,614 |
| 2018 | $1,633 | $147,614 | $28,000 | $119,614 |
| 2017 | $1,556 | $147,614 | $28,000 | $119,614 |
| 2016 | $1,524 | $147,614 | $28,000 | $119,614 |
| 2015 | $1,677 | $160,048 | $33,000 | $127,048 |
| 2014 | -- | $160,048 | $33,000 | $127,048 |
Source: Public Records
Map
Nearby Homes
- 3705 Rivermist Dr
- 3604 Rivermist Dr
- 3445 Dutchman Rd
- 2414 Quarry Ridge Ln
- 2911 Benevolence Dr
- 2756 Shepherd Valley St
- 2403 Savior St
- 2518 Shepherd Valley St
- 3101 Rendezvous Dr
- 2424 Shepherd Valley St
- 4105 Crowfield Dr
- 3101 Riverbrooke Dr
- 4312 Viewmont Dr
- 3140 Slippery Elm Dr
- 3030 Rock Quarry Rd
- 2816 Smoke Place
- 213 Gatewood Dr
- 3513 Diamond Springs Dr
- 308 Plaza Dr
- 2929 Tuckland Dr
- 2839 Orchard Trace Way
- 2831 Orchard Trace Way
- 2843 Orchard Trace Way
- 2827 Orchard Trace Way
- 3726 Rivermist Dr
- 3730 Rivermist Dr
- 3722 Rivermist Dr
- 2836 Orchard Trace Way
- 3734 Rivermist Dr
- 2832 Orchard Trace Way
- 2847 Orchard Trace Way
- 2821 Orchard Trace Way
- 3718 Rivermist Dr
- 2828 Orchard Trace Way
- 2844 Orchard Trace Way
- 3738 Rivermist Dr
- 2809 Orchard Trace Way
- 2824 Orchard Trace Way
- 2851 Orchard Trace Way
- 3714 Rivermist Dr