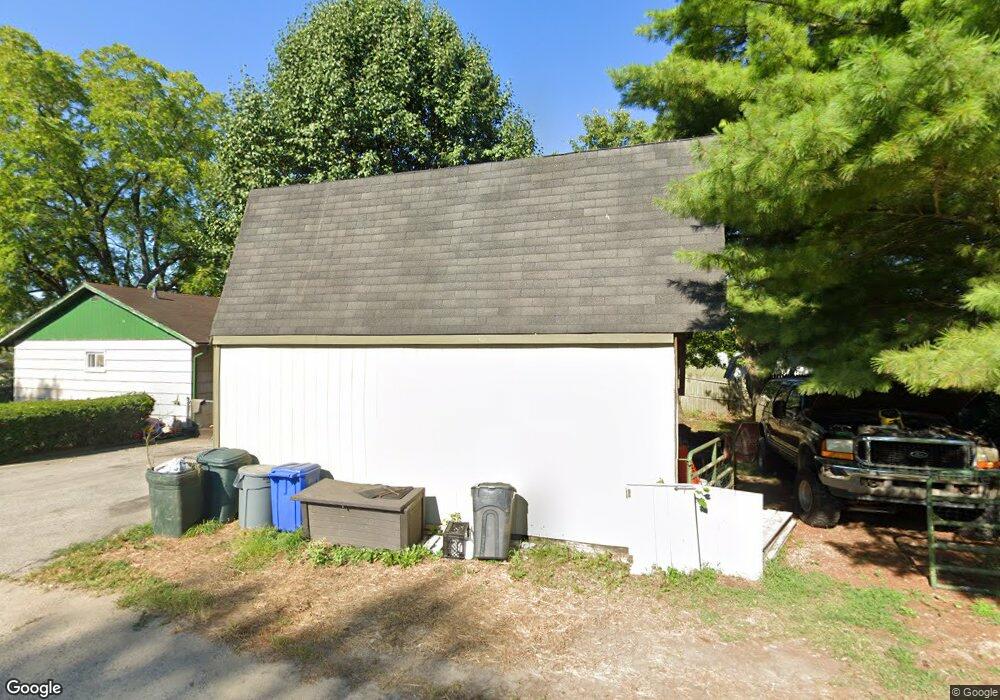
2836 Duvall Rd Lockbourne, OH 43137
Estimated Value: $133,140 - $536,000
2
Beds
1
Bath
840
Sq Ft
$341/Sq Ft
Est. Value
About This Home
This home is located at 2836 Duvall Rd, Lockbourne, OH 43137 and is currently estimated at $286,035, approximately $340 per square foot. 2836 Duvall Rd is a home located in Pickaway County.
Ownership History
Date
Name
Owned For
Owner Type
Purchase Details
Closed on
Jul 16, 2021
Sold by
Roush Ray C
Bought by
Roush Ray C and Roush Valerie A
Current Estimated Value
Purchase Details
Closed on
Aug 16, 2013
Sold by
The Secretary Of Veterans Affairs
Bought by
Roush Ray C
Purchase Details
Closed on
Mar 4, 2013
Sold by
Hipp James M
Bought by
Secretary Of Veterans Affairs
Purchase Details
Closed on
Sep 29, 1999
Sold by
Carter Philip S
Bought by
Hipp James M and Hipp Kathy A
Home Financials for this Owner
Home Financials are based on the most recent Mortgage that was taken out on this home.
Original Mortgage
$81,498
Interest Rate
7.93%
Mortgage Type
VA
Purchase Details
Closed on
Dec 2, 1991
Sold by
Carter Philip S
Bought by
Carter Philip S
Purchase Details
Closed on
May 1, 1986
Purchase Details
Closed on
Mar 1, 1985
Create a Home Valuation Report for This Property
The Home Valuation Report is an in-depth analysis detailing your home's value as well as a comparison with similar homes in the area
Purchase History
| Date | Buyer | Sale Price | Title Company |
|---|---|---|---|
| Roush Ray C | -- | Northwest Ttl Fam Companies | |
| Roush Ray C | $17,500 | Multiple | |
| Secretary Of Veterans Affairs | $20,000 | Attorney | |
| Hipp James M | $79,900 | -- | |
| Carter Philip S | -- | -- | |
| -- | $31,900 | -- | |
| -- | $21,500 | -- |
Source: Public Records
Mortgage History
| Date | Status | Borrower | Loan Amount |
|---|---|---|---|
| Previous Owner | Hipp James M | $81,498 |
Source: Public Records
Tax History
| Year | Tax Paid | Tax Assessment Tax Assessment Total Assessment is a certain percentage of the fair market value that is determined by local assessors to be the total taxable value of land and additions on the property. | Land | Improvement |
|---|---|---|---|---|
| 2025 | $1,281 | $25,920 | $1,970 | $23,950 |
| 2024 | $1,281 | $25,920 | $1,970 | $23,950 |
| 2023 | $1,005 | $25,920 | $1,970 | $23,950 |
| 2022 | $923 | $21,940 | $1,620 | $20,320 |
| 2021 | $876 | $21,940 | $1,620 | $20,320 |
| 2020 | $878 | $21,940 | $1,620 | $20,320 |
| 2019 | $0 | $17,680 | $1,530 | $16,150 |
| 2018 | $739 | $17,680 | $1,530 | $16,150 |
| 2017 | $758 | $17,680 | $1,530 | $16,150 |
| 2016 | $684 | $15,880 | $1,450 | $14,430 |
| 2015 | $342 | $15,880 | $1,450 | $14,430 |
| 2014 | $685 | $15,880 | $1,450 | $14,430 |
| 2013 | $754 | $17,320 | $1,450 | $15,870 |
Source: Public Records
Map
Nearby Homes
- 2864 W Old Duvall Ct
- 2901 W Old Duvall Ct
- 2767 W Old Duvall Ct
- 2713 W Old Duvall Ct
- 10942 Bulen Pierce Rd
- 10874 Bulen Pierce Rd
- 10910 Bulen Pierce Rd
- 3109 E Old Duvall Ct
- 10976 Bulen Pierce Rd
- 11048 Ashville Pike
- 10695 Lockbourne Eastern Rd
- 10755 Lockbourne Eastern Rd
- 10621 Lockbourne Eastern Rd
- 10591 Lockbourne Eastern Rd
- 10555 Lockbourne Eastern Rd
- 11879 Lockbourne Eastern Rd
- 11280 U S 23
- 10610 E State Route 762 Unit 23 B
- 10694 E State Route 762
- 4800 Duvall Rd Unit 207
- 2828 Duvall Rd
- 2828 W Old Duvall Ct
- 0 W Old Duvall Ct
- 2802 W Old Duvall Ct
- 2864 Duvall Rd
- 2848 Duvall Rd
- 2802 W Old Duvall Ct
- 2802 Duvall Rd
- 2839 Duvall Rd
- 2801 Duvall Rd
- 10941 Dennis Rd
- 2789 W Old Duvall Ct
- 2789 Duvall Rd
- 2892 W Old Duvall Ct
- 2760 Duvall Rd
- 2901 W Old Duvall Ct
- 2901 W Old Duvall Ct
- 2767 Duvall Rd
- 2924 W Old Duvall Ct
- 2901 Duvall Rd
Your Personal Tour Guide
Ask me questions while you tour the home.