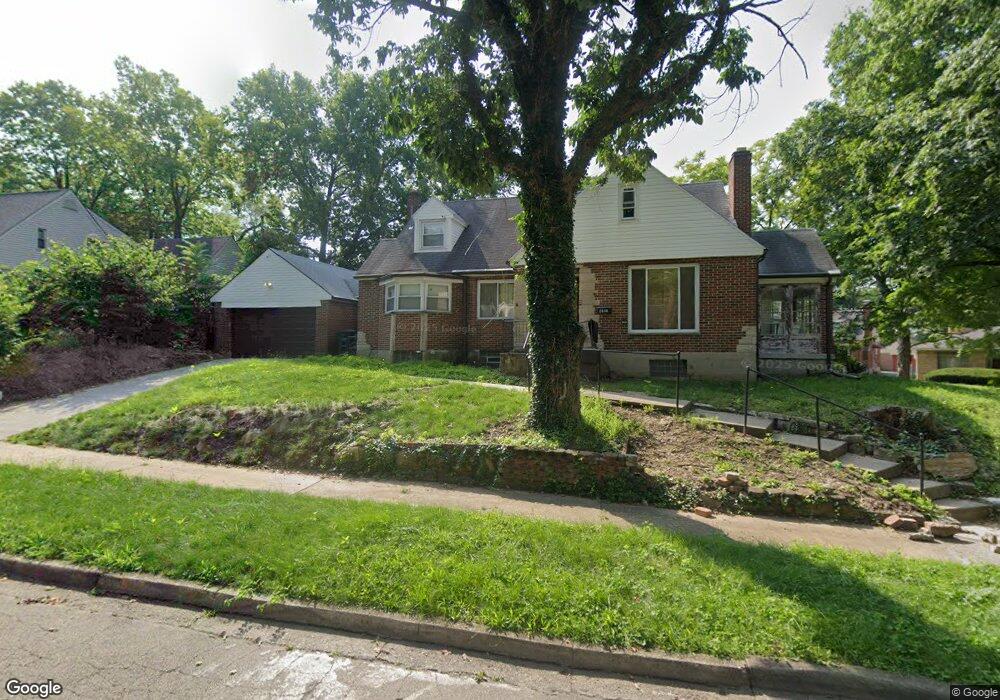
2836 Holmes Ave Dayton, OH 45406
Cornell Heights NeighborhoodEstimated Value: $129,000 - $162,000
4
Beds
2
Baths
1,884
Sq Ft
$77/Sq Ft
Est. Value
About This Home
This home is located at 2836 Holmes Ave, Dayton, OH 45406 and is currently estimated at $145,373, approximately $77 per square foot. 2836 Holmes Ave is a home located in Montgomery County with nearby schools including Valerie Elementary School, Dayton Leadership Academies, and Imagine Klepinger Road Community School.
Ownership History
Date
Name
Owned For
Owner Type
Purchase Details
Closed on
Apr 29, 2016
Sold by
Johnson Kinta
Bought by
Hicks Erin M
Current Estimated Value
Home Financials for this Owner
Home Financials are based on the most recent Mortgage that was taken out on this home.
Original Mortgage
$51,058
Outstanding Balance
$40,764
Interest Rate
3.75%
Mortgage Type
FHA
Estimated Equity
$104,609
Purchase Details
Closed on
Mar 21, 2013
Sold by
City Of Dayton
Bought by
Johnson Kinta
Purchase Details
Closed on
Apr 16, 2012
Sold by
Gieseking Craig
Bought by
City Of Dayton
Purchase Details
Closed on
Jul 12, 2002
Sold by
Taylor Bruce M and Taylor Mary J
Bought by
Gieseking Craig M and Gieseking Karen
Home Financials for this Owner
Home Financials are based on the most recent Mortgage that was taken out on this home.
Original Mortgage
$65,000
Interest Rate
6.82%
Create a Home Valuation Report for This Property
The Home Valuation Report is an in-depth analysis detailing your home's value as well as a comparison with similar homes in the area
Home Values in the Area
Average Home Value in this Area
Purchase History
| Date | Buyer | Sale Price | Title Company |
|---|---|---|---|
| Hicks Erin M | $52,000 | Vantage Land Title | |
| Johnson Kinta | -- | None Available | |
| City Of Dayton | -- | None Available | |
| Gieseking Craig M | $67,500 | -- |
Source: Public Records
Mortgage History
| Date | Status | Borrower | Loan Amount |
|---|---|---|---|
| Open | Hicks Erin M | $51,058 | |
| Previous Owner | Gieseking Craig M | $65,000 |
Source: Public Records
Tax History Compared to Growth
Tax History
| Year | Tax Paid | Tax Assessment Tax Assessment Total Assessment is a certain percentage of the fair market value that is determined by local assessors to be the total taxable value of land and additions on the property. | Land | Improvement |
|---|---|---|---|---|
| 2024 | $1,314 | $23,260 | $5,500 | $17,760 |
| 2023 | $1,314 | $23,260 | $5,500 | $17,760 |
| 2022 | $1,692 | $23,260 | $5,500 | $17,760 |
| 2021 | $1,683 | $23,260 | $5,500 | $17,760 |
| 2020 | $1,683 | $23,260 | $5,500 | $17,760 |
| 2019 | $1,437 | $17,620 | $6,850 | $10,770 |
| 2018 | $1,439 | $17,620 | $6,850 | $10,770 |
| 2017 | $1,422 | $17,620 | $6,850 | $10,770 |
| 2016 | $1,523 | $17,510 | $6,850 | $10,660 |
| 2015 | $1,442 | $17,510 | $6,850 | $10,660 |
| 2014 | $1,442 | $17,510 | $6,850 | $10,660 |
| 2012 | -- | $27,980 | $8,720 | $19,260 |
Source: Public Records
Map
Nearby Homes
- 1312 Canfield Ave
- 1045 Philadelphia Dr
- 1341 Shaftesbury Rd
- 1200 Wilson Dr
- 1812 Haverhill Dr
- 1424 Shaftesbury Rd
- 1233 Everett Dr
- 1365 Alcott Dr
- 2022 W Grand Ave
- 620 Shoop Ave
- 1460 Kipling Dr
- 1205 Windsor Ave
- 1643 Earlham Dr
- 1119 Windsor Ave
- 927 Maplehurst Ave
- 559 Evergreen Ave
- 1240 Windsor Ave
- 676 Brooklyn Ave
- 539 Evergreen Ave
- 936 Walton Ave
- 2826 Holmes Ave
- 2815 Athens Ave
- 2841 Holmes Ave
- 2826 Athens Ave
- 2832 Athens Ave
- 2835 Holmes Ave
- 2853 Holmes Ave
- 2820 Athens Ave
- 2838 Athens Ave
- 2829 Holmes Ave
- 2814 Athens Ave
- 2861 Holmes Ave
- 2900 Athens Ave
- 2814 Holmes Ave
- 2807 Athens Ave
- 2808 Athens Ave
- 2908 Athens Ave
- 2821 Holmes Ave
- 2911 Athens Ave
- 2914 Athens Ave