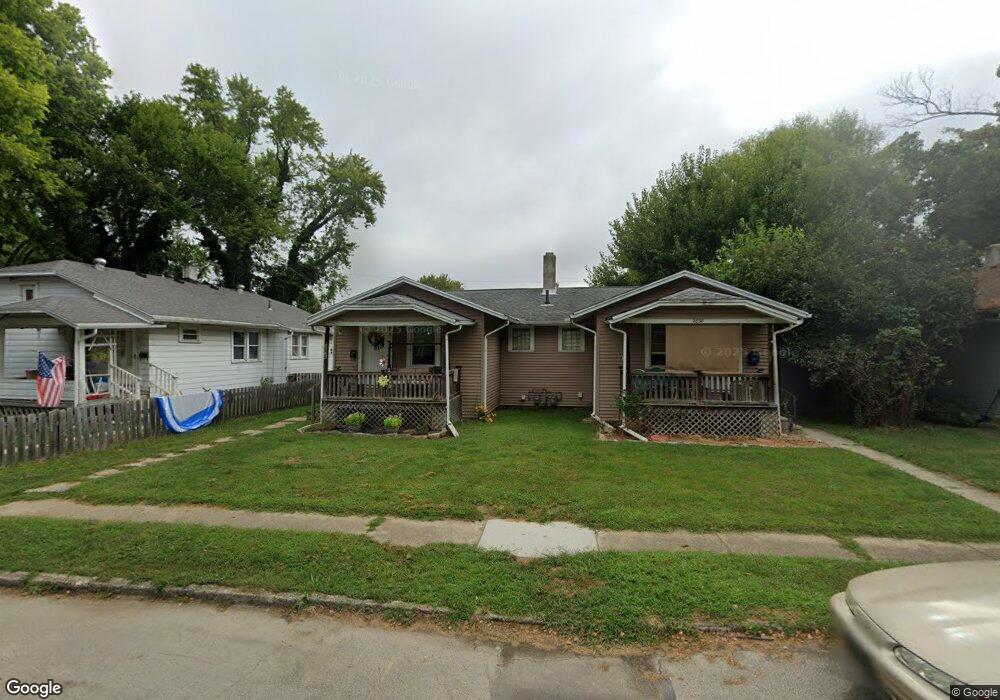
2836 Lansing Dr Unit 2338 Dayton, OH 45420
Belmont NeighborhoodEstimated Value: $134,000 - $164,601
2
Beds
2
Baths
1,576
Sq Ft
$97/Sq Ft
Est. Value
About This Home
This home is located at 2836 Lansing Dr Unit 2338, Dayton, OH 45420 and is currently estimated at $153,650, approximately $97 per square foot. 2836 Lansing Dr Unit 2338 is a home located in Montgomery County with nearby schools including Horace Mann Elementary School, Cleveland Elementary School, and Eastmont Elementary.
Ownership History
Date
Name
Owned For
Owner Type
Purchase Details
Closed on
Jul 8, 2020
Sold by
Middleton Scott and Middletowjf Scott
Bought by
Middleton Scott
Current Estimated Value
Purchase Details
Closed on
Mar 18, 2020
Sold by
Ater James K and Ater Judith E
Bought by
Middletown Scott
Purchase Details
Closed on
May 30, 2003
Sold by
University Of Dayton
Bought by
Ater James K and Ater Judith E
Home Financials for this Owner
Home Financials are based on the most recent Mortgage that was taken out on this home.
Original Mortgage
$50,399
Interest Rate
5.4%
Mortgage Type
Purchase Money Mortgage
Purchase Details
Closed on
Nov 15, 2002
Sold by
Tangeman Richard D and Tangeman Janice R
Bought by
The University Of Dayton and Richard D Tangeman Charitable Remainder
Purchase Details
Closed on
Nov 13, 2002
Sold by
Tangeman Rita A and Tangeman Donald C
Bought by
The University Of Dayton and Tangeman Charitable Remainder Unitrust
Create a Home Valuation Report for This Property
The Home Valuation Report is an in-depth analysis detailing your home's value as well as a comparison with similar homes in the area
Home Values in the Area
Average Home Value in this Area
Purchase History
| Date | Buyer | Sale Price | Title Company |
|---|---|---|---|
| Middleton Scott | -- | None Available | |
| Middletown Scott | $33,000 | Vantage Land Title | |
| Ater James K | $56,000 | -- | |
| The University Of Dayton | -- | -- | |
| The University Of Dayton | -- | -- | |
| Tangeman Rita A | -- | -- | |
| Tangeman Donald C | -- | -- |
Source: Public Records
Mortgage History
| Date | Status | Borrower | Loan Amount |
|---|---|---|---|
| Previous Owner | Ater James K | $50,399 |
Source: Public Records
Tax History Compared to Growth
Tax History
| Year | Tax Paid | Tax Assessment Tax Assessment Total Assessment is a certain percentage of the fair market value that is determined by local assessors to be the total taxable value of land and additions on the property. | Land | Improvement |
|---|---|---|---|---|
| 2024 | $2,388 | $41,110 | $9,070 | $32,040 |
| 2023 | $2,388 | $41,110 | $9,070 | $32,040 |
| 2022 | $2,145 | $28,500 | $6,300 | $22,200 |
| 2021 | $2,134 | $28,500 | $6,300 | $22,200 |
| 2020 | $2,129 | $28,500 | $6,300 | $22,200 |
| 2019 | $2,086 | $25,220 | $7,000 | $18,220 |
| 2018 | $2,089 | $25,220 | $7,000 | $18,220 |
| 2017 | $2,074 | $25,220 | $7,000 | $18,220 |
| 2016 | $2,071 | $23,940 | $7,000 | $16,940 |
| 2015 | $1,960 | $23,940 | $7,000 | $16,940 |
| 2014 | $1,960 | $23,940 | $7,000 | $16,940 |
| 2012 | -- | $21,100 | $7,700 | $13,400 |
Source: Public Records
Map
Nearby Homes
- 2900 Lansing Dr
- 434 Bellaire Ave
- 150 Nordale Ave
- 1029 Wilmington Ave
- 1065 Patterson Rd
- 816 Wilmington Ave
- 1121 Patterson Rd
- 826 Bellaire Ave
- 3125 Cottage Terrace
- 2637 Westfield Ave
- 709 Wilmington Ave
- 724 Patterson Rd
- 2538 Mundale Ave
- 312 Shroyer Rd
- 2242 Nill Ave
- 2520 Westfield Ave
- 936 Westminster Place
- 525 Watervliet Ave
- 557 Shroyer Rd
- 1025 Morse Ave
- 2836 Lansing Dr
- 2830 Lansing Dr
- 2842 Lansing Dr
- 2824 Lansing Dr
- 2848 Lansing Dr
- 2837 Revere Ave
- 2831 Revere Ave
- 2845 Revere Ave
- 2837 Lansing Dr
- 2835 Lansing Dr
- 2825 Revere Ave
- 2839 Lansing Dr
- 2820 Lansing Dr
- 2854 Lansing Dr
- 2849 Revere Ave
- 2831 Lansing Dr
- 2847 Lansing Dr
- 2825 Lansing Dr
- 2821 Revere Ave
- 2855 Revere Ave