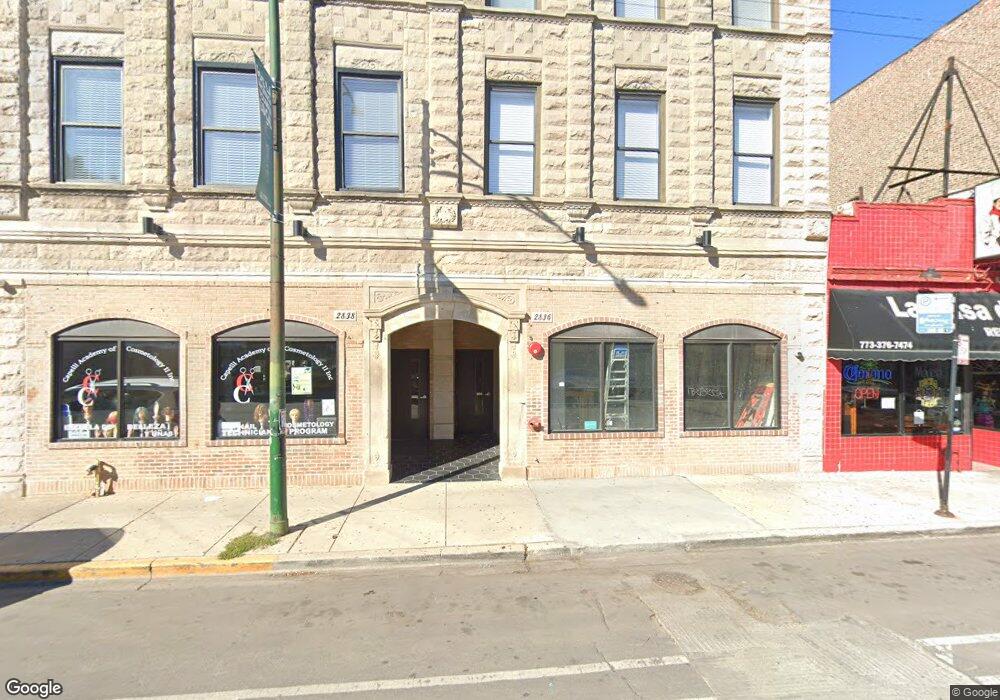
2836 W Cermak Rd Chicago, IL 60623
Little Village NeighborhoodEstimated Value: $603,000 - $674,000
6
Beds
7
Baths
6,635
Sq Ft
$96/Sq Ft
Est. Value
About This Home
This home is located at 2836 W Cermak Rd, Chicago, IL 60623 and is currently estimated at $638,500, approximately $96 per square foot. 2836 W Cermak Rd is a home located in Cook County with nearby schools including Hammond Elementary School.
Ownership History
Date
Name
Owned For
Owner Type
Purchase Details
Closed on
Apr 13, 2020
Sold by
Linares Samuel and Linares Alicia
Bought by
Edificio Cermak Llc
Current Estimated Value
Purchase Details
Closed on
Mar 11, 2015
Sold by
Aguirre David V
Bought by
Linares Samuel
Purchase Details
Closed on
Dec 14, 2004
Sold by
Candelario Justina and Candelario Amado
Bought by
Aguirre David V
Home Financials for this Owner
Home Financials are based on the most recent Mortgage that was taken out on this home.
Original Mortgage
$412,500
Interest Rate
6.5%
Mortgage Type
Commercial
Purchase Details
Closed on
Aug 13, 2003
Sold by
Candelaria Justina and Diaz Donicio
Bought by
Candelario Amado and Candelario Justina
Home Financials for this Owner
Home Financials are based on the most recent Mortgage that was taken out on this home.
Original Mortgage
$350,000
Interest Rate
8%
Mortgage Type
Commercial
Purchase Details
Closed on
Jul 10, 1995
Sold by
Cole Taylor Bank
Bought by
Castillo Serafin and Castillo Maria
Create a Home Valuation Report for This Property
The Home Valuation Report is an in-depth analysis detailing your home's value as well as a comparison with similar homes in the area
Home Values in the Area
Average Home Value in this Area
Purchase History
| Date | Buyer | Sale Price | Title Company |
|---|---|---|---|
| Edificio Cermak Llc | -- | Attorney | |
| Linares Samuel | $215,000 | None Available | |
| Aguirre David V | $575,000 | Cti | |
| Candelario Amado | -- | Chicago Title Insurance Comp | |
| Castillo Serafin | -- | -- |
Source: Public Records
Mortgage History
| Date | Status | Borrower | Loan Amount |
|---|---|---|---|
| Previous Owner | Aguirre David V | $412,500 | |
| Previous Owner | Candelario Amado | $350,000 |
Source: Public Records
Tax History Compared to Growth
Tax History
| Year | Tax Paid | Tax Assessment Tax Assessment Total Assessment is a certain percentage of the fair market value that is determined by local assessors to be the total taxable value of land and additions on the property. | Land | Improvement |
|---|---|---|---|---|
| 2024 | $7,419 | $38,704 | $4,423 | $34,281 |
| 2023 | $7,232 | $35,162 | $3,584 | $31,578 |
| 2022 | $7,232 | $35,162 | $3,584 | $31,578 |
| 2021 | $7,071 | $35,161 | $3,583 | $31,578 |
| 2020 | $5,081 | $22,808 | $3,583 | $19,225 |
| 2019 | $2,906 | $14,462 | $3,583 | $10,879 |
| 2018 | $2,857 | $14,462 | $3,583 | $10,879 |
| 2017 | $5,160 | $23,971 | $3,202 | $20,769 |
| 2016 | $2,027 | $10,118 | $3,202 | $6,916 |
| 2015 | $1,854 | $10,118 | $3,202 | $6,916 |
| 2014 | $1,166 | $6,284 | $3,050 | $3,234 |
| 2013 | $1,525 | $8,387 | $3,050 | $5,337 |
Source: Public Records
Map
Nearby Homes
- 2824 W Cermak Rd
- 2249 S Marshall Blvd
- 2835 W Cullerton St
- 2135 S Fairfield Ave
- 2306 S Sacramento Ave
- 2732 W 23rd Place
- 2649 W 21st Place
- 2653 W 21st St
- 2326 S Sacramento Ave
- 2340 S Sacramento Ave
- 2613 W 21st St
- 2702 W 24th St
- 2633 W 23rd Place
- 2604 W 23rd Place
- 2848 W 25th St
- 2658 W 24th Place
- 2655 W 24th Place
- 2236 W 23rd Place
- 2837 W 25th St
- 2701 W 24th Place
- 2838 W Cermak Rd
- 2842 W Cermak Rd
- 2832 W Cermak Rd
- 2844 W Cermak Rd
- 2830 W Cermak Rd
- 2830 W Cermak Rd Unit 1
- 2846 W Cermak Rd
- 2848 W Cermak Rd
- 2850 W Cermak Rd
- 2850 W Cermak Rd Unit 2
- 2822 W Cermak Rd
- 2841 W Cermak Rd
- 2833 W Cermak Rd
- 2843 W Cermak Rd
- 2827 W Cermak Rd
- 2827 W Cermak Rd Unit 1
- 2827 W Cermak Rd Unit 2
- 2839 W Cermak Rd Unit 1
- 2816 W Cermak Rd
- 2825 W Cermak Rd Unit 3